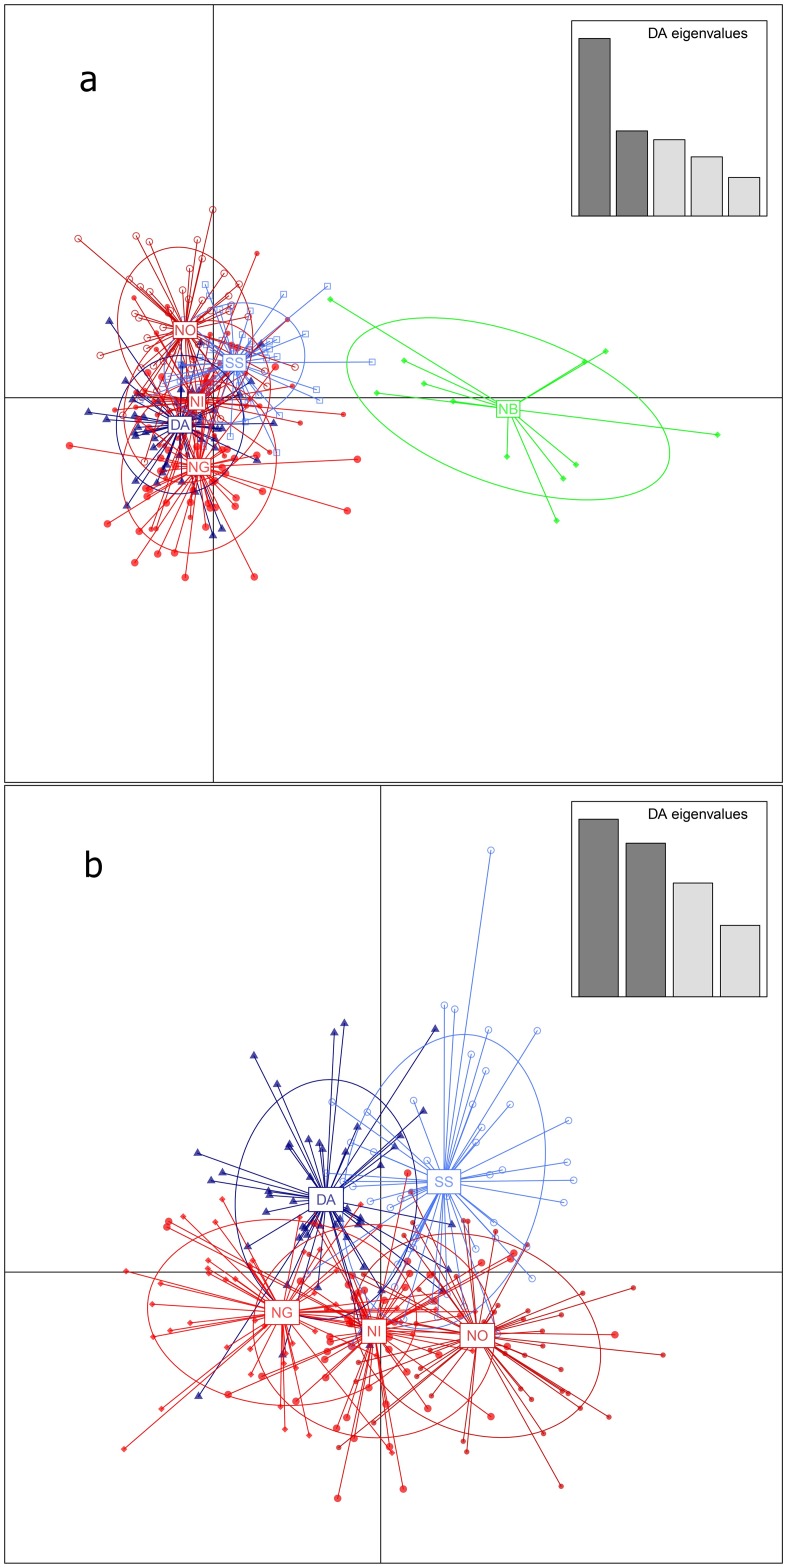
Fig 3. Discriminant Analysis of Principal Components (DAPC).
Scatter plot with (a) and without (b) location NB in the analysis. Sampling locations are internally connected with lines to the center of each ellipses. The Danish and Swedish samples are indicated by blue colors (DA, dark blue and SS, light blue), the Norwegian outlier location (NB, green) is differentiated from the remaining Norwegian samples (NI, NO, and NG) represented by red color.

