
Fig. 2.
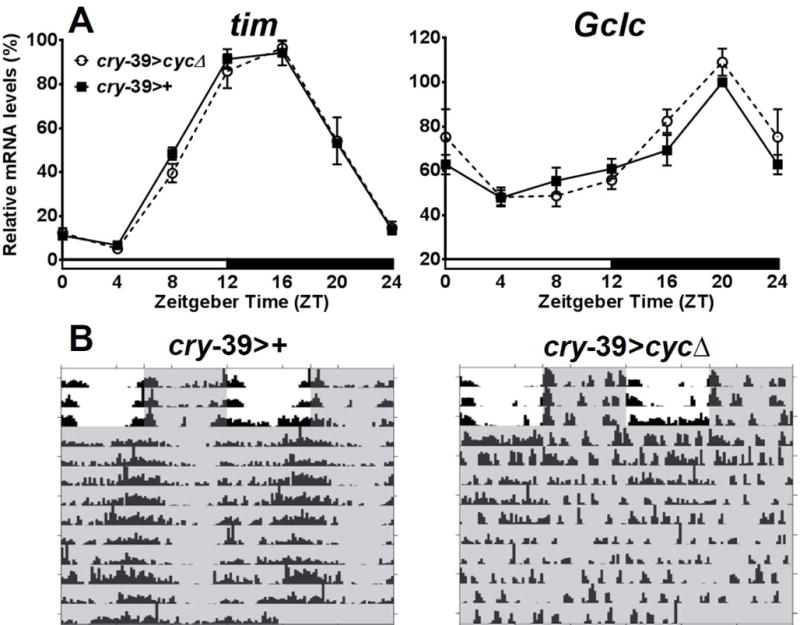
Expression of tim and Gclc in Drosophila melanogaster with a disrupted central clock. (A) Both tim and Gclc mRNA expression profiles are similar in cry-39>cycΔ and cry-39>+ control. Levels are normalized to the reference gene robl. Values are reported as percent of peak expression in the control and represent mean of 3 biological replicates ± SEM. Two-way ANOVA with Bonferonni post-test showed no significant difference in tim or Gclc expression between the two genotypes at each time point, but within each genotype, a significant difference between peak and trough expression (P<0.0001 for both genotypes in tim; P < 0.0001 for both genotypes in Gclc). (B) Representative examples of locomotor activity in cry-39>+ and cry-39>cycΔ. Shaded areas represent periods of darkness.