
Fig. 4.
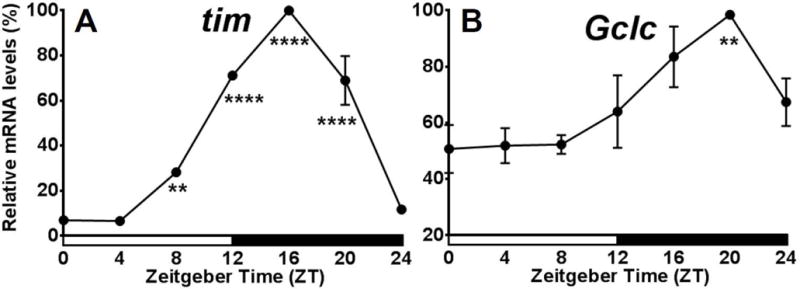
Expression profiles of tim and Gclc in eya2 Drosophila melanogaster. mRNA levels of tim (A) and Gclc (B) in heads of eya2 flies. Levels are normalized to the reference gene rp49. Values are reported as percent of peak expression and represent mean of 3 independent biological replicates ± SEM. Stars indicate a significant difference from the trough using one-way ANOVA with Bonferonni post-test (**P < 0.01, ****P < 0.0001).