
Fig. 6.
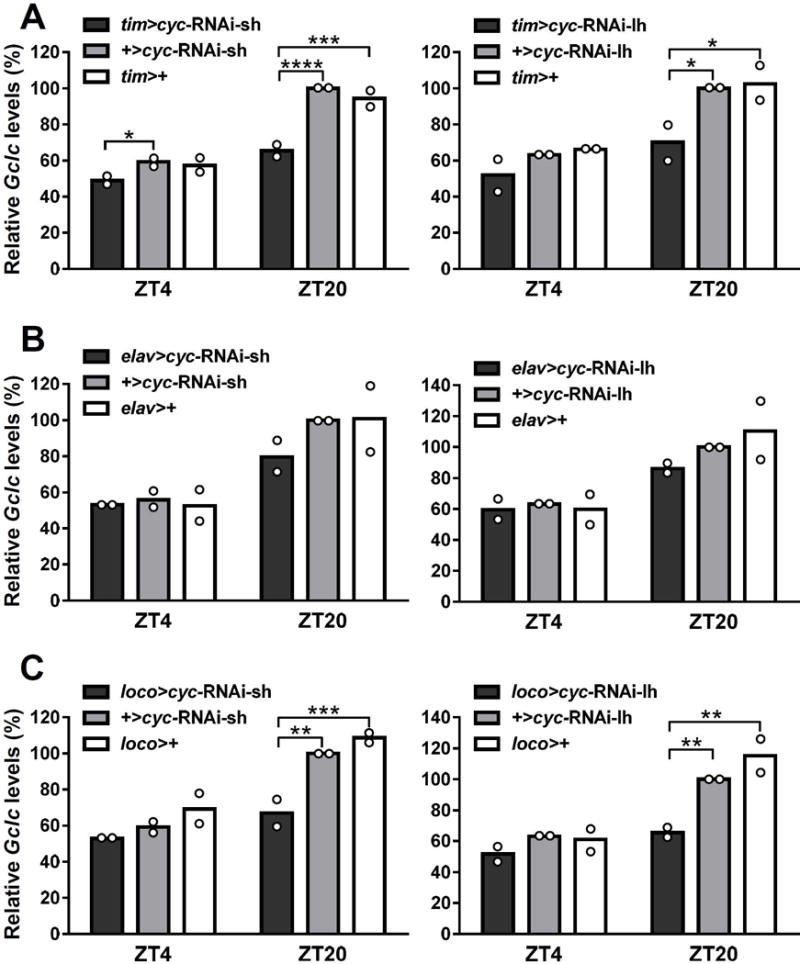
Gclc mRNA profiles in heads of Drosophila melanogaster flies with clock disrupted in all clock cells, neurons only, or glia only. Expression of Gclc in flies expressing cyc-RNAi-sh or cyc-RNAi-lh driven by (A) tim-Gal4, (B) elav-Gal4, or (C) loco-Gal4. Levels of Gclc mRNA are normalized to the reference gene rp49. Each bar represents mean of 2 biological replicates, with dots showing individual replicate values. Mean expression levels at ZT4 (trough) and ZT20 (peak) were compared between genotypes using two-way ANOVA. Values are reported as percent of peak expression in the responder-only control. Stars indicate a significant difference (*P < 0.05, **P < 0.01, ***P < 0.001, ****P < 0.0001).