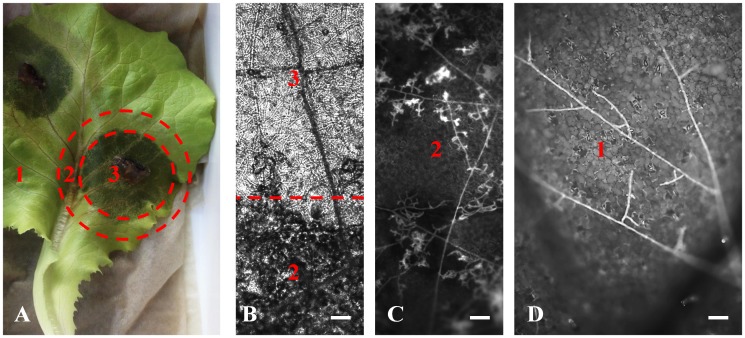
Fig 1. Epifluorescence microscopy of the three interaction zones 1 to 3.
(A) Overview microscopic picture depicting all three interaction zones. In Zone 1 specialized infection structures have not been formed and the lettuce cells appear symptomless, in contrast to Zone 2. In the third interaction zone, all lettuce cells appear to have been destroyed. (B) Bright-field microscopic image of Zones 3 and 2. (C) UV-microscopic image of Zone 2 using a GFP filter. (D) UV-microscopic image of Zone 1 using a DAPI filter. The scale bar represents 50 μm.

