
Figure 1.
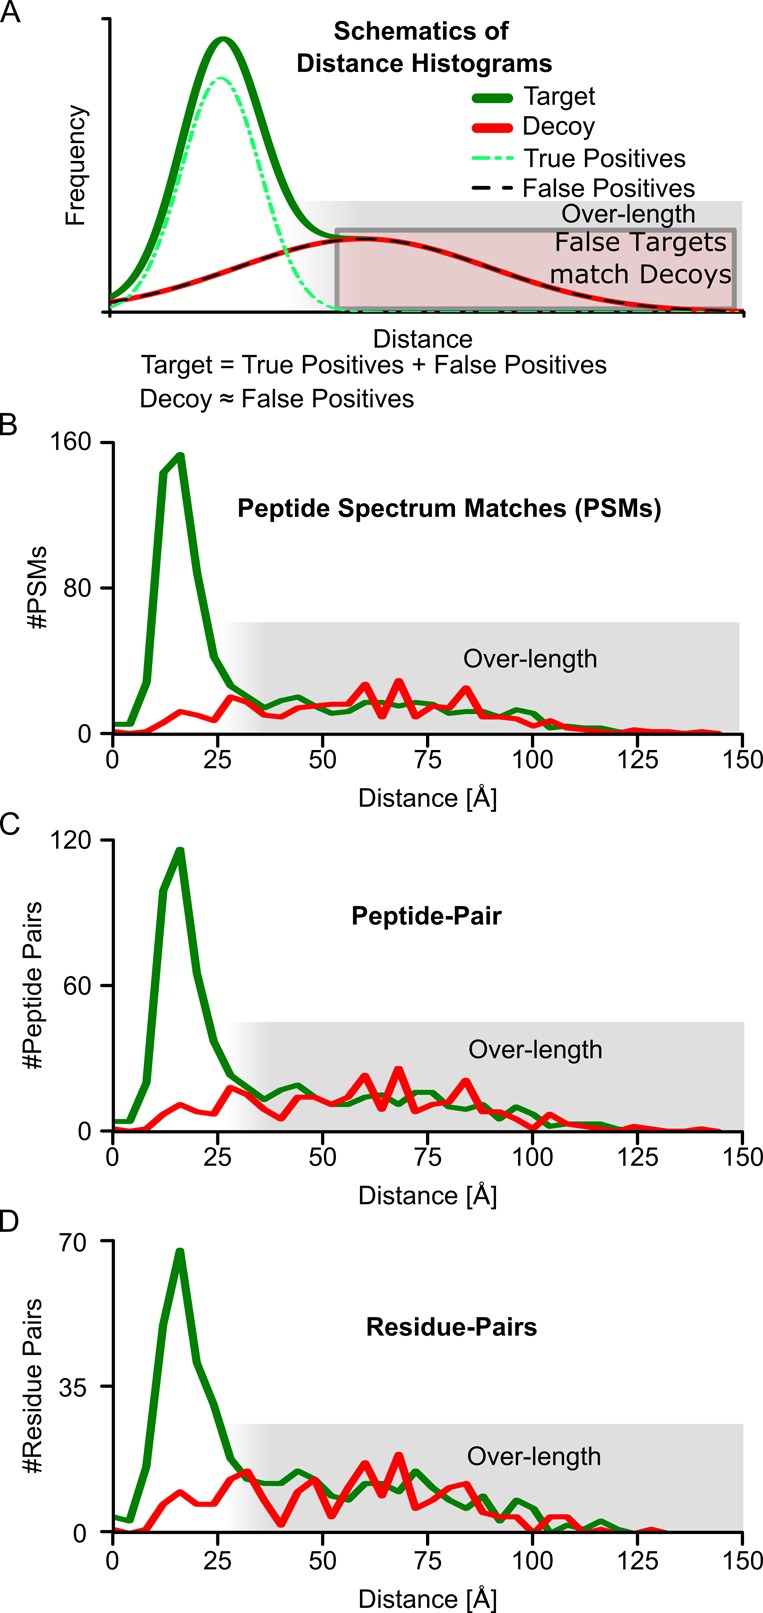
Validation of FDR on different levels by crystal structure. (A) Schematic distance-histograms showing the expected overlap of false positive and decoys and resulting overlap of overlength cross-links with decoy cross-links. (B) Residue-pair distance-histogram based on identified PSMs for a PSM FDR of 50%. (C) Residue-pair distance-histogram based on identified peptide pairs for a peptide-pair FDR cutoff of 50%, calculated at the level of peptide pairs. (D) Residue pair distance-histogram for a residue-pair FDR of 50%. All distances are Cα–Cα distances of the identified residue pairs in a crystal structure of Pol II (PDB|1WCM).