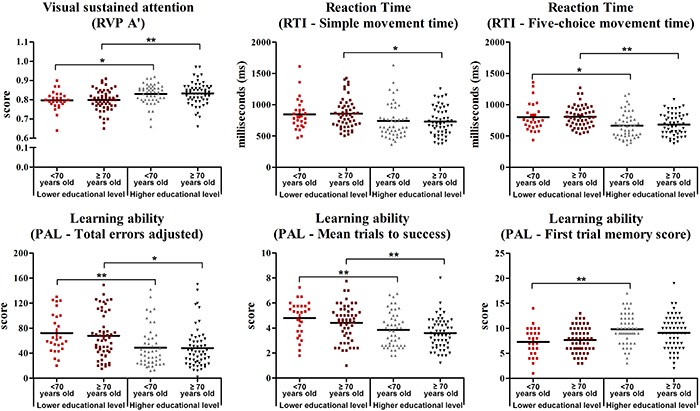
Figure 1. Graphical representations of cognitive performance. Results show the dispersal distribution of cognitive performance test scores in the lower education level <70 years old group (red dots); lower education level ≥70 years old group (dark red dots); higher education level <70 years old group (gray triangles); and higher education level ≥70 years old group (dark gray triangles). Black bars represent the mean score. RVP: Rapid Visual Information Processing; RTI: Reaction Time; PAL: Paired Associates Learning. *P<0.05; **P<0.01 (two-way ANOVA).

