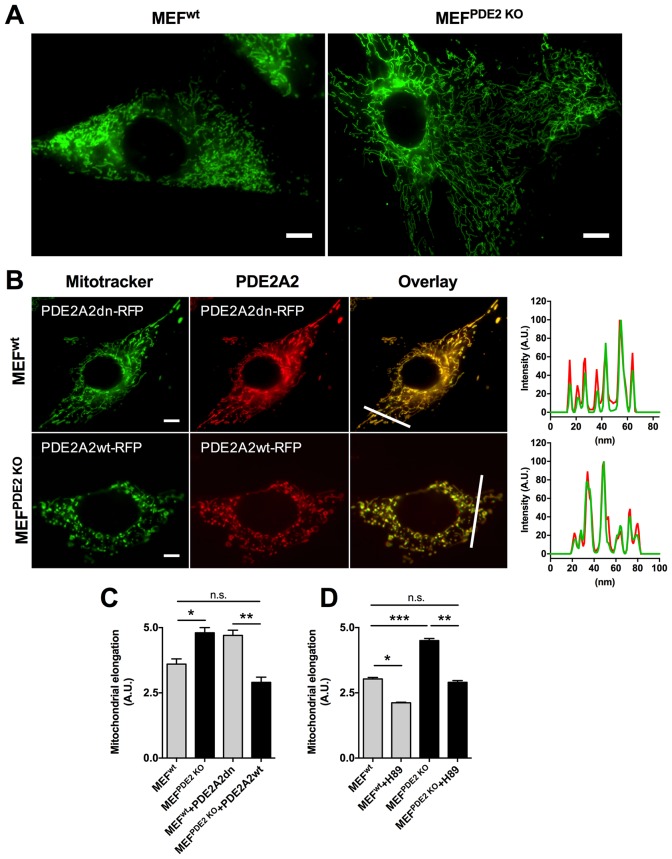
Figure 2. Mitochondria morphology is affected by PDE2A knock out.
(A) Wild type (MEFwt) and PDE2KO (MEFPDE2KO) mouse embryonic fibroblasts stained with mitotracker green. Scale bar: 10 µm. (B) MEFwt and MEFPDE2KO expressing catalytically inactive (PDE2A2dn-RFP) or wild type (PDE2A2wt-RFP) PDE2A2, respectively and stained with mitotracker green. The overlay of the RFP and mitotracker signal is also shown. Panels on the right show the fluorescence intensity profile for the mitotracker (red line) and PDE2A2-RFP proteins (green line) along with the line shown in the overlay images. Scale bar: 10 µm. (C) Quantitative analysis of mitochondria morphology on images shown in B. n = 35 cells from three biological replicates. (D) Quantitative analysis of mitochondria morphology in MEF cells treated with the PKA inhibitor H89. n = 25 cells from two biological replicates. ANOVA test with Bonferroni correction was used for statistical analysis. *0.01≤p≤0.05, **0.001≤p<0.01, ***p<0.001.

