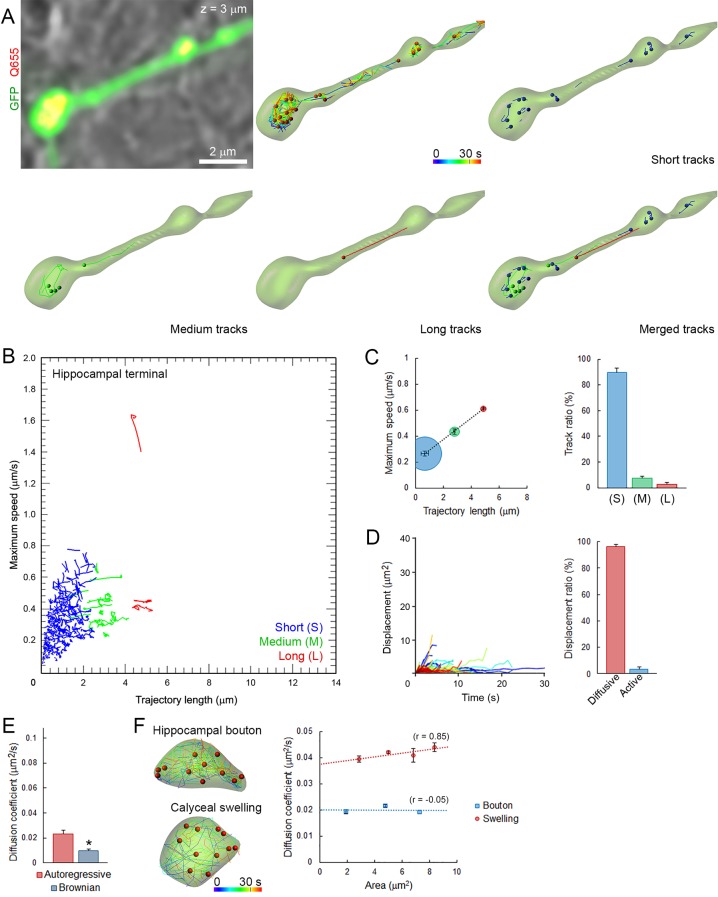
Figure 3. Small and homogeneous SV movements occur at small conventional synapses.
(A) Live confocal imaging of a hippocampal bouton expressing cytosolic GFP- and Q655-Syt2-labeled vesicles, with SV tracking color-coded over time, or sorted according to trajectory lengths (Blue <2 µm, Green 2–4 µm and Red >4 µm). (B) Scatter plot of SV trajectory lengths and maximum speeds superimposed with individual trajectory traces, color-coded as in (A). (C) Classification and quantification of SV movements in three groups based on their maximum speed and trajectory length (n = 2958 trajectories). (D) Displacement curves and displacement modalities (Red: diffusive motion, Blue: active motion) of identified traces (n = 2958). (E) Diffusion coefficients of SVs in hippocampal terminals calculated from autoregressive (Red) or Brownian (Blue) analysis (n = 9 terminals). Two-tailed unpaired t-test (*p<0.05). (F) Comparison of SV mobility in hippocampal boutons (n = 9) or calyceal swellings (n = 9).
DOI: http://dx.doi.org/10.7554/eLife.24845.022

