. 2017 Apr 22;6:e24845. doi: 10.7554/eLife.24845

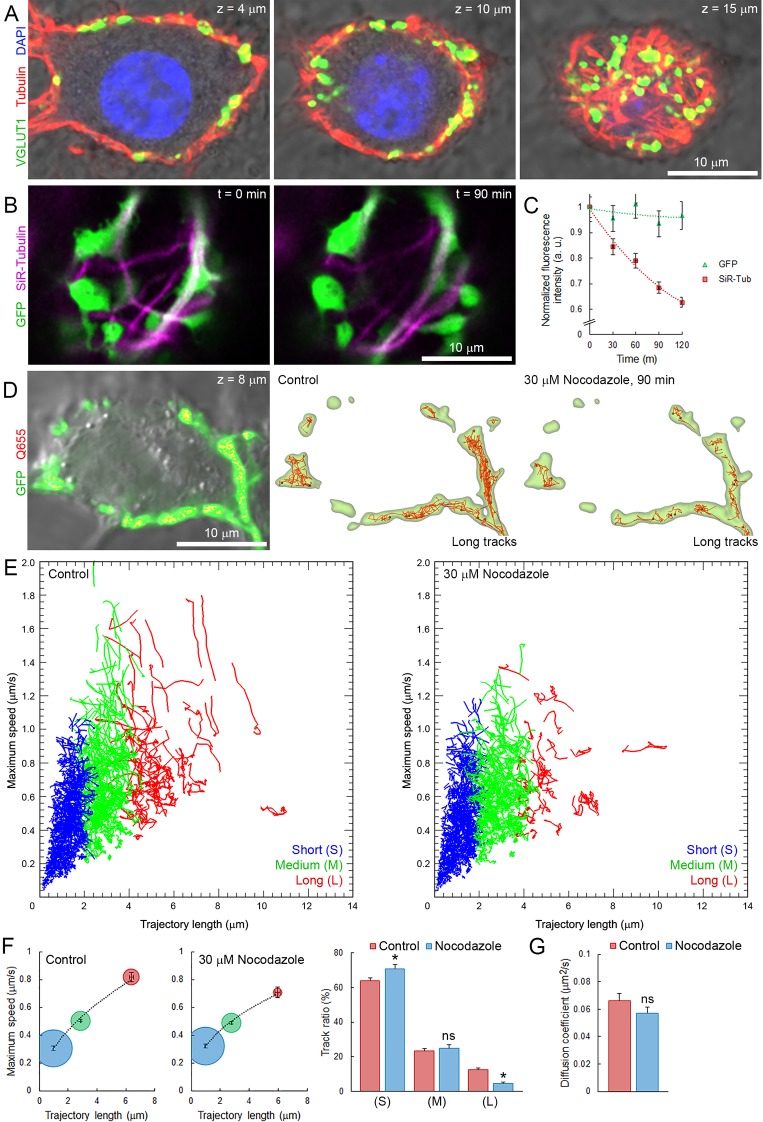
Figure 6. Presynaptic MT network regulates long and rapid directional SV movements.

(A) Confocal z-stack imaging of a calyceal terminal labelled with antibodies against de-tyrosinated α-tubulin (Red), VGLUT1 (Green) and DAPI (Blue). (B) Live confocal imaging of a calyceal terminal over-expressing GFP and labeled with SiR-Tubulin before and after treatment with 30 µM Nocodazole. (C) Quantification of GFP- and SiR-Tubulin fluorescence intensity during nocodazole treatment. (D) Live confocal imaging of a calyceal terminal expressing cytosolic GFP and Q655-Syt2 labeled vesicles, and SV tracking (long tracks displayed only). (E) Scatter plot of SV trajectory lengths and maximum speeds superimposed with individual trajectory traces in control (left panel) or nocodazole-treated terminals (right panel), color-coded (Blue <2 µm, Green 2–4 µm and red >4 µm). (F) Classification and quantification of SV movements in three groups based on their maximum speeds and trajectory lengths in control (Red, n = 8 terminals) and nocodazole-treated (Blue, n = 8) terminals. (G) Diffusion coefficient of SVs in control (Red, n = 8) and nocodazole-treated (Blue, n = 8) terminals. Two-tailed unpaired t-test (*p<0.05; ns, not significant).

DOI: http://dx.doi.org/10.7554/eLife.24845.031

Figure 6—source data 1. Data and statistics for Figure 6F and G.
DOI: 10.7554/eLife.24845.032

Figure 6.

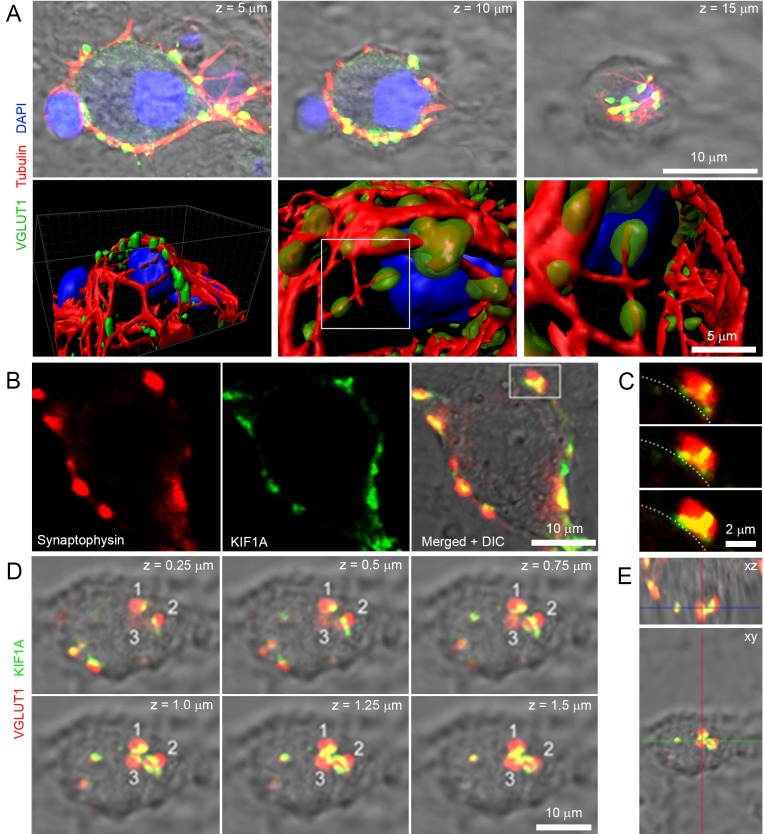
Figure 6—figure supplement 1. Microtubules and kinesins localize in giant calyceal terminals.

Figure 6—figure supplement 1.

(A) Upper panels: confocal z-stack imaging of giant terminals in culture for 18 days and labeled with antibodies against de-tyrosinated α-tubulin (Red), VGLUT1 (Green) and DAPI (Blue). Lower panels: 3D rendering of images shown above. (B) Confocal images of a giant terminal labeled with antibodies against synaptophysin (Red) and KIF1A (Green). (C) Expanded view of the presynaptic swelling delimited in (B) in three consecutive z-stacks; dotted line represents the putative position of the synaptic cleft relative to the swelling. (D) Confocal z-stack imaging of a giant terminal labeled with antibodies against VGLUT1 (Red) and KIF1A (Green). (E) Orthogonal view of the terminal shown in (D).
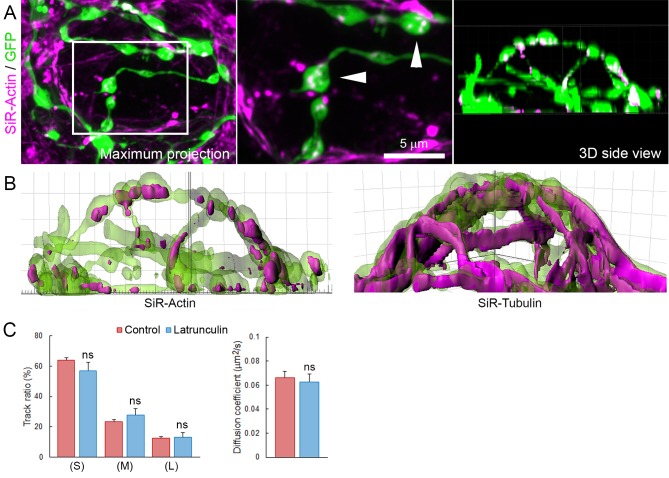
Figure 6—figure supplement 2. Actin network localizes in presynaptic swellings.

Figure 6—figure supplement 2.

(A) Live confocal imaging of SiR-Actin in giant cultured terminals over-expressing cytosolic GFP. (B) Volume rendering of SiR-Actin and SiR-Tubulin in GFP-overexpressing giant terminals. (C) Proportion SV trajectories and diffusion coefficient in control (Red, n = 8) and 10 µM latrunculin-A-treated (Blue, n = 4) terminals. Two-tailed unpaired t-test (ns, not significant).