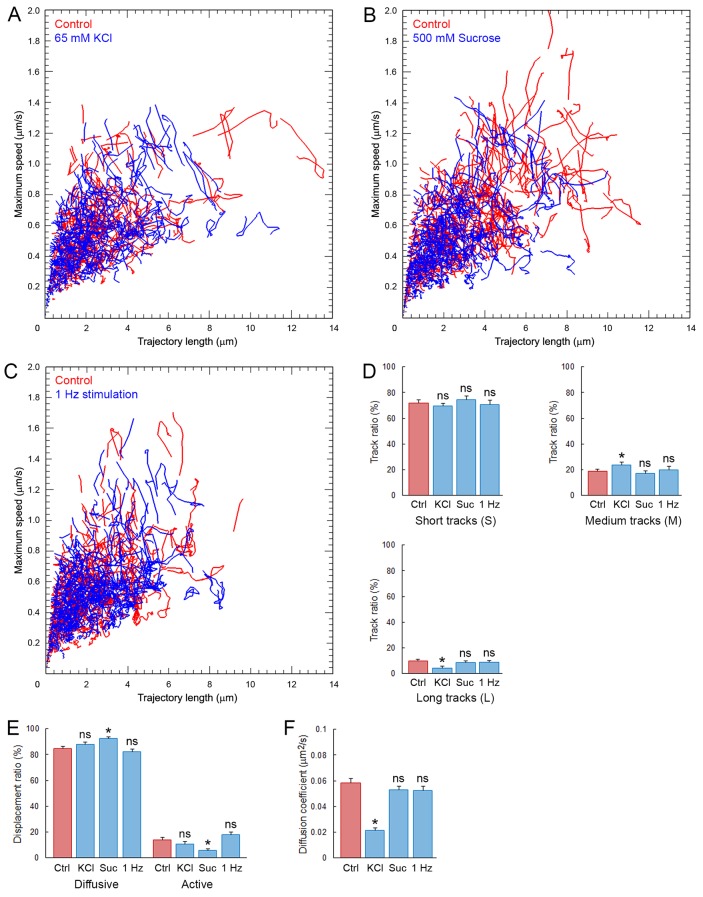
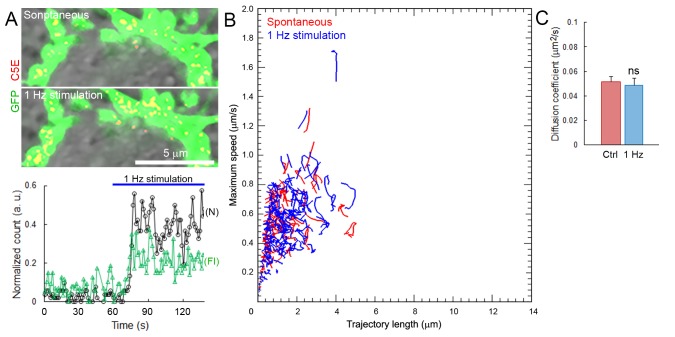
Figure 7. Synaptic stimulation does not increase SV mobility.
Analysis of C5E-Syt2-labeled SVs in giant calyceal terminals. (A) KCl stimulation: Scatter plot of SV trajectory lengths and maximum speeds superimposed with individual trajectory traces in control terminals (Red) or terminals incubated with 65 mM KCl (Blue). (B) Sucrose stimulation: Scatter plot of SV trajectory lengths and maximum speeds superimposed with individual trajectory traces in control terminals (Red) or terminals incubated with 500 mM sucrose (Blue). (C) Electrical simulation: Scatter plot of SV trajectory lengths and maximum speeds superimposed with individual trajectory traces in control terminals (Red) or terminals during 1 Hz electrical field stimulation for 30 s (Blue). (D) Trajectory length analysis in control (Red) and KCl-treated terminals, sucrose-treated terminals, or 1 Hz-stimulated (Blue) terminals. (E) Displacement modality analysis in control (Red) and KCl-treated terminals, sucrose-treated terminals, or 1 Hz-stimulated (Blue) terminals. (F) Diffusion coefficient analysis in control (Red) and KCl-treated terminals, sucrose-treated terminals, or 1 Hz-stimulated (Blue) terminals. (KCl treatment: n = 6; sucrose treatment: n = 6; 1 Hz stimulation: n = 6 in D, (E and F). Two-tailed unpaired t-test (*p<0.05; ns, not significant).
DOI: http://dx.doi.org/10.7554/eLife.24845.035


