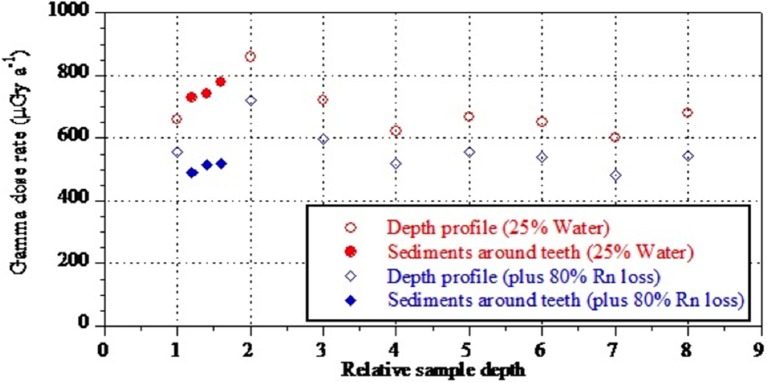
Figure 10. Gamma dose rate reconstructions derived from analytical data of sediment samples collected around ESR samples 1767, 1788 and 1810 (closed circles and diamonds), combined with samples from a vertical profile in the excavation pit and sondage (open circles and diamonds).
The data show little variation in dose rate with depth (see text for explanation).

