
Figure 1.
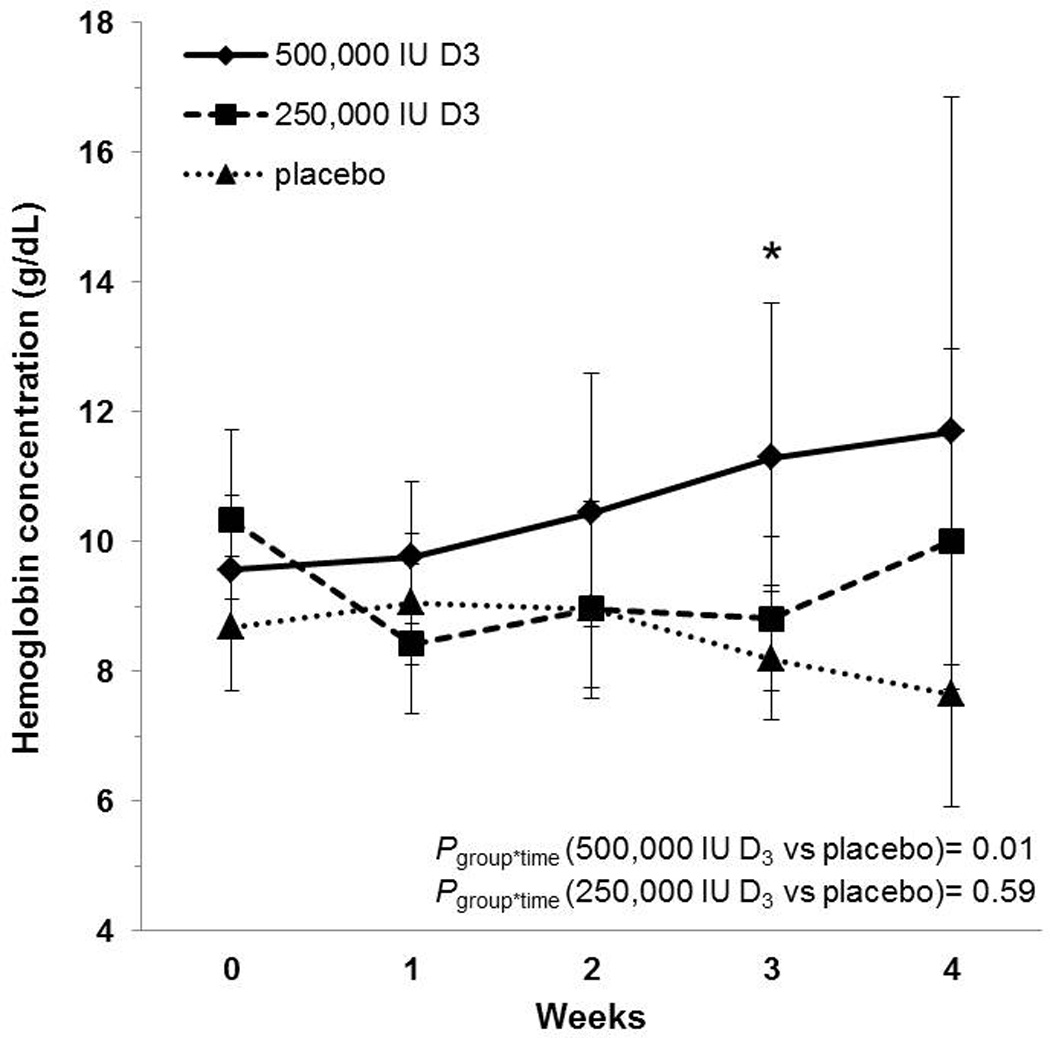
Geometric mean hemoglobin concentrations with corresponding 95% confidence intervals in critically ill adults. Hemoglobin concentrations are reported across time and by treatment group. Hemoglobin concentrations increased significantly over time in the group that received 500,000 IU D3 compared to the placebo group; there was no significant change in the 250,000 IU D3 group. By three weeks, hemoglobin concentrations in the 500,000 IU D3 group differed significantly from the placebo group; there were no statistically significant differences between groups at other time points. *P<0.05; group*time, group-by-time interaction. Sample sizes in the placebo, 250,000 IU D3, and 500,000 IU D3 groups, respectively: enrollment n = 10, 9, 11; 1 week n = 9, 9, 9; 2 weeks n = 8, 6, 5; 3 weeks n = 5, 4, 2; 4 weeks n = 2, 2, 1.