
Figure 2.
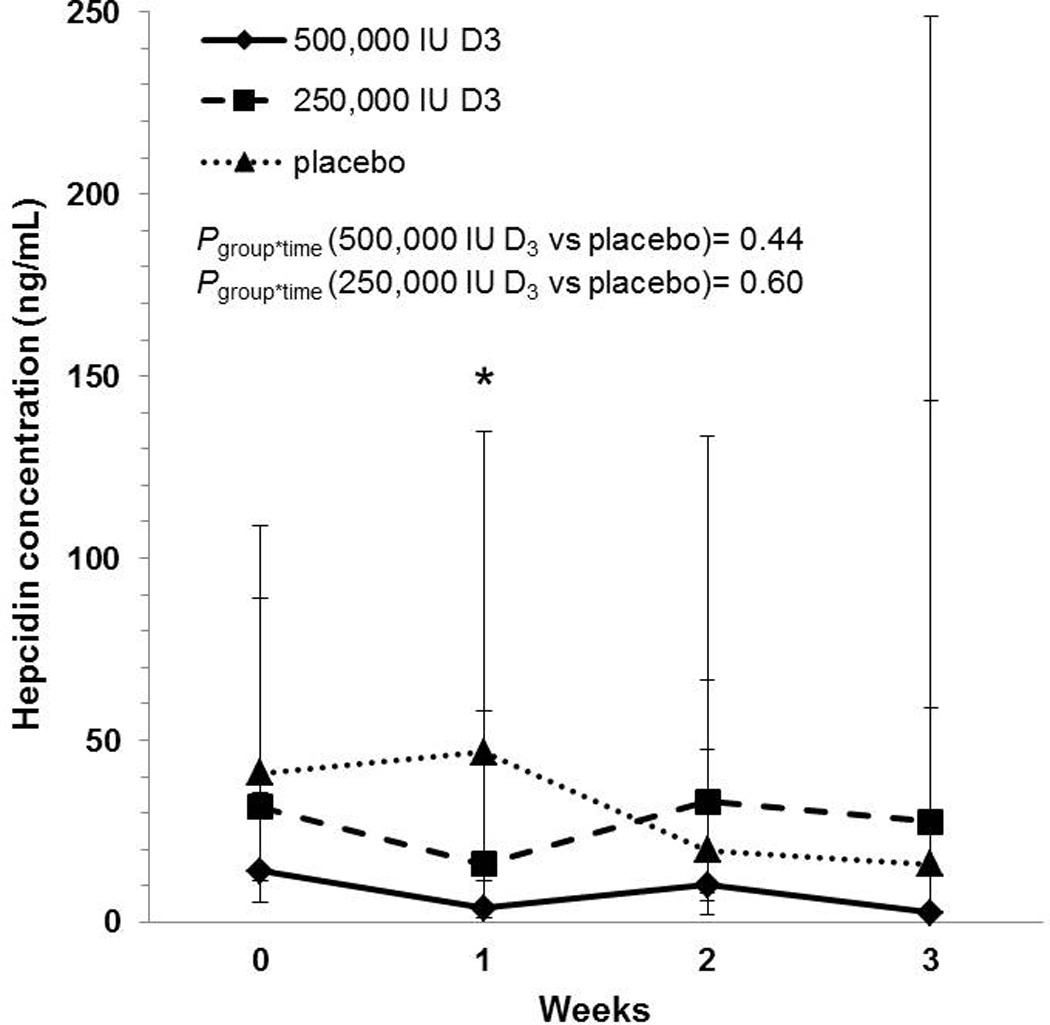
Geometric mean hepcidin concentrations with corresponding 95% confidence intervals in critically ill adults. Hepcidin concentrations are reported across time and by treatment group. There were no significant differences over time in hepcidin concentrations in either vitamin D-treated group relative to placebo. Hepcidin concentrations in the 500,000 IU D3 group differed significantly from the placebo group one week after dosing; there were no statistically significant differences between groups at other time points. *P<0.05; group*time, group-by-time interaction. Sample sizes in the placebo, 250,000 IU D3, and 500,000 IU D3 groups, respectively: enrollment n = 10, 9, 11; 1 week n = 9, 6, 9; 2 weeks n = 8, 6, 5; 3 weeks n = 4, 4, 2.