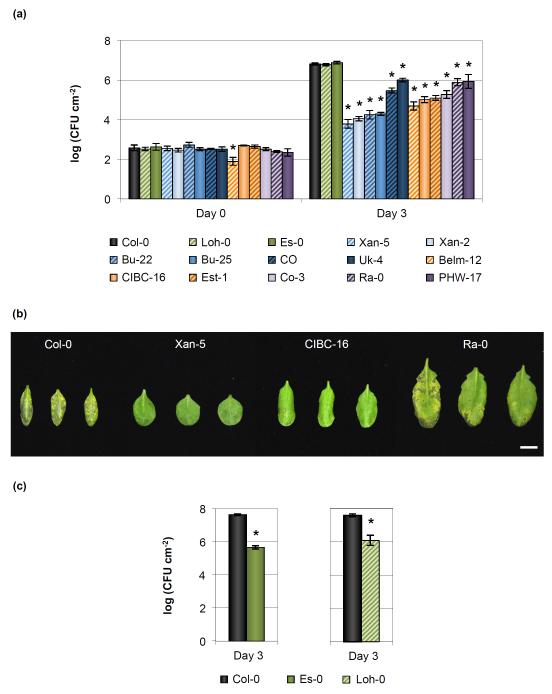
Fig. 1.
Natural variation of resistance to Pseudomonas syringae pv. tomato (Pst) DC3000 amongst Arabidopsis accessions. (a) Bacterial growth in resistant Arabidopsis thaliana accessions at 0 and 3 d after syringe-infiltration with 105 colony-forming units (CFU) ml−1 of Pst DC3000. Error bars show ± SE of the mean of 3 (for day 0) or at least 5 (day 3) biological samples. Bars are colored according to the type of resistance observed in this study: green, plant surface-mediated resistance; blue, hypersensitive-like cell death response; orange, enhanced salicylic acid defenses; and purple, unknown. The asterisk indicates accessions whose bacterial growth was significantly different when compared to the susceptible Col-0 control as determined by a Dunnett’s test (P < 0.05). Statistical analyses for each day after infection were done separately. (b) Disease symptoms in select resistant A. thaliana accessions 3 d after syringe-infiltration with 105 CFU ml−1 of Pst DC3000. Bar, 1 cm. Image was composed from accessions’ individual images from a single experiment. (c) Bacterial populations are reduced in Es-0 and Loh-0 accessions when bacteria are inoculated on the surface of plants. Bacterial growth was quantified 3 d after dip-inoculation with 108 CFU ml−1 of Pst DC3000. Error bars show ± SE of the mean of 4 biological samples. The asterisk indicates accessions whose bacterial growth was significantly different when compared to the susceptible Col-0 control as determined by a Student’s t-test (P < 0.05).

