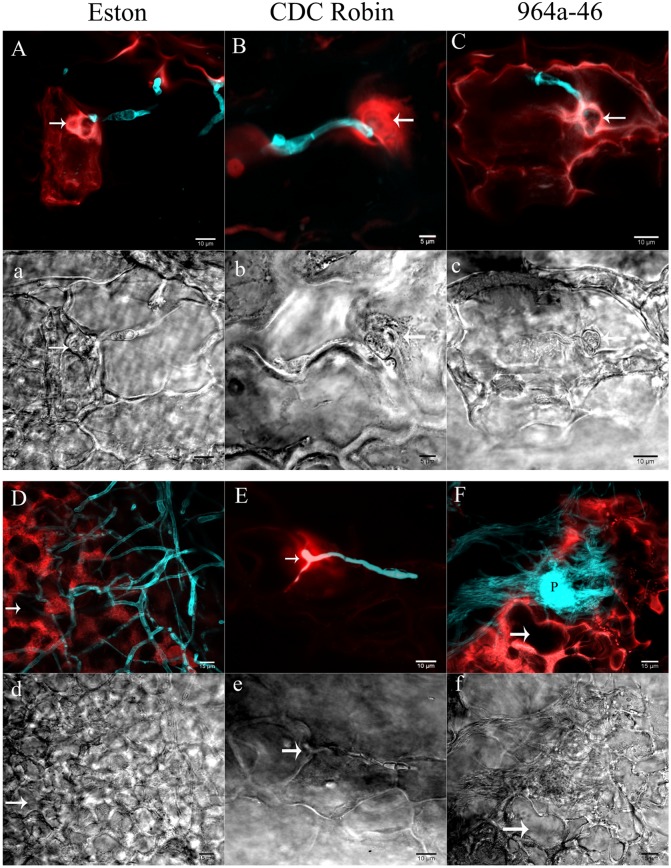
FIGURE 3.
Cellular reactions of partially resistant lentil genotypes to A. lentis infection captured by two photon CLSM at 60 (A,a,B,b,C,c) and 90 hpi (D,d,E,e,F,f). Microscopic fields of vision were simultaneously scanned using fluorescence (capital letters) and differential interference contrast (DIC) filters (small letters). Fungal structures (cyan) were stained with Uvitex-2b. Autofluorescent signals developed in the host epidermal cells in response to pathogen infection are in red. Arrows in images show the penetration site except for (d) and (f), where arrows indicate the cavity developed as a result of the destruction of cell contents. P in (F) shows a newly developed pycnidium formed on the mass of mycelium. Scale bars are indicated at the bottom right of each image.

