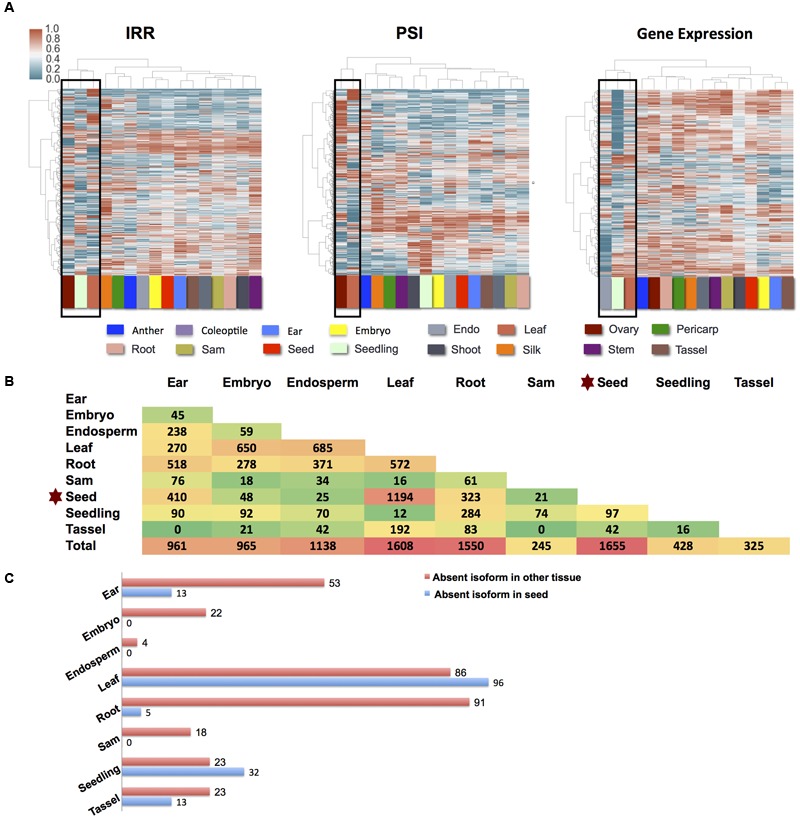
FIGURE 2.

AS difference among different tissues. (A) Characterization IRR, PSI, and gene expression across 16 different B73 tissues. Intron retention and exon skipping isoforms presented required an FPKM ≥ 1 IRR or PSI values between 0.05 and 0.95 across all tissues. All genes presented in the expression analysis panel were required to have FPKM ≥ 1. Hierarchical clustering was performed using the Ward’s method after a log transform. Outlying clusters are boxed. (B) Number of differential splicing genes for pairwise CuffDiff comparison among nine tissues in B73. Results were filtered to ensure that at least one isoform for each gene was present at FPKM ≥ 5 in each condition and that at least one isoform for each gene is higher expressed in each condition. Considering the variability and multiple datasets, FPKM 5 was chosen to be stringent to filter noise in the differential splicing results. (C) Based on the differential splicing results between seed and other tissues (B and Supplemental Data 4) potential present and absent (PAV) isoforms can be detected. Those isoforms with expression levels >2 FPKM in one tissue and <0.1 in the other were considered to be PAV.
