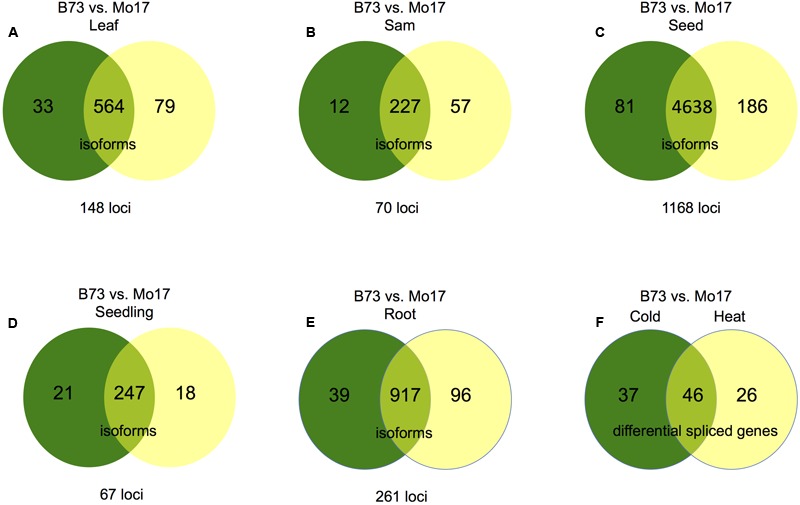
FIGURE 5.

Genotype specific AS between B73 and Mo17. For figures (A–E) numbers in the left portion of the Venn diagrams (green) represent isoforms absent in B73 but present in Mo17; numbers in the right portion of the Venn diagrams (yellow) represent isoforms absent in Mo17 but present in B73. Numbers in the overlap regions represent isoforms follow other patterns, but also in differentially spliced genes. (A) Differential AS between B73 and Mo17 in leaf tissue. (B) Differential AS between B73 and Mo17 in SAM tissue. (C) Differential AS between B73 and Mo17 in seed tissue. (D) Differential AS between B73 and Mo17 in seedling tissue. (E) Differential AS between B73 and Mo17 in root tissue. (F) Genes that undergo differential AS between B73 and Mo17 in response to cold and heat stress. The number of genes that are differentially spliced between Mo17 and B73 under cold stress that are not responsive to heat stress are presented on the left. The number of genes that are differentially spliced between Mo17 and B73 under heat stress that are not responsive to cold stress are presented on the right, The number of genes that are differentially spliced between Mo17 and B73 under both heat and cold stress are presented at the interface.
