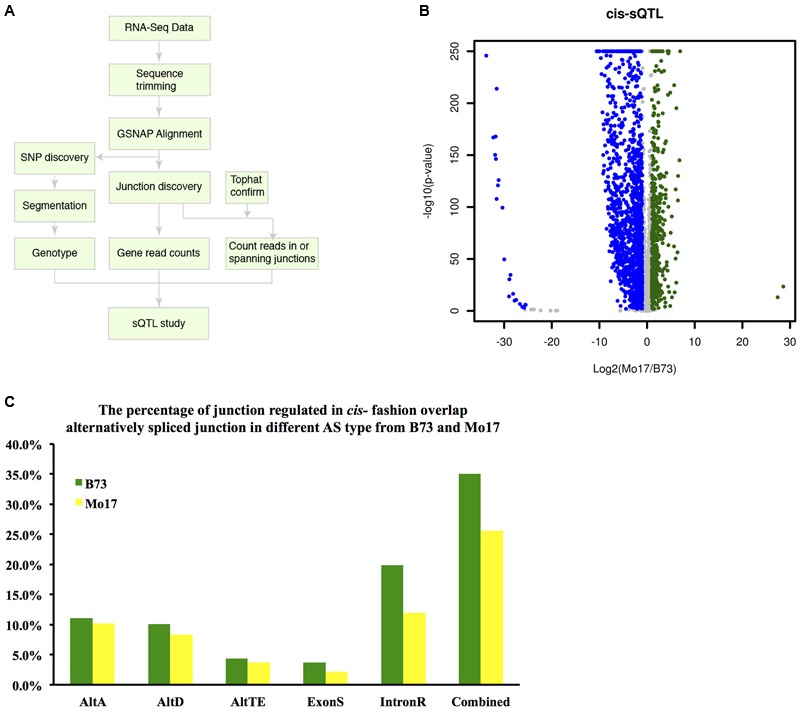
FIGURE 6.

Cis-sQTL analysis. (A) Flow chart describing the splicing QTL analysis. (B) Cis-sQTL results. Blue indicates higher expression in B73 (more intron junction read coverage), while green indicates higher expression in Mo17 (more intron junction read coverage). (C) Overlap between cis-sQTL junction and the alternatively spliced junction in each AS events in genotype B73 and Mo17.
