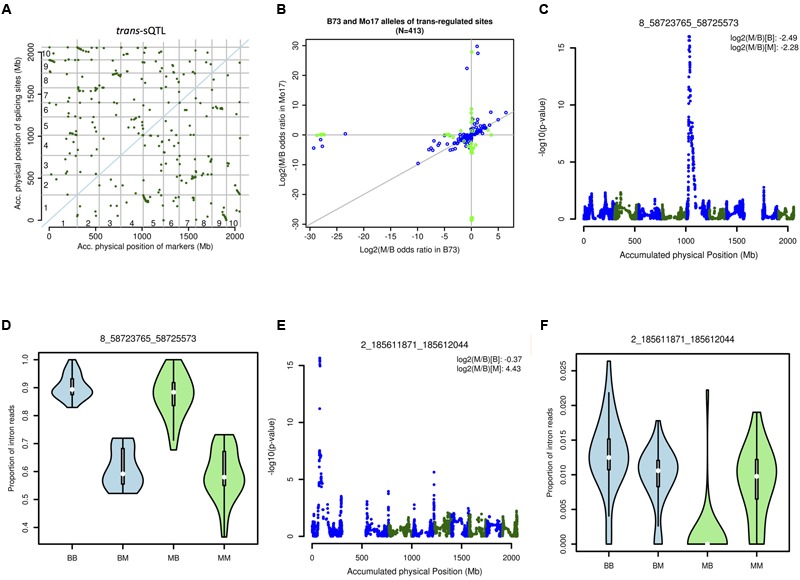
FIGURE 7.

Trans-sQTL analysis. (A) Distribution of trans-sQTL on the maize chromosomes. (B) Interaction between the marker and the junction. Blue: significant trans-effect but not significant cis- trans- interaction. Green: significant trans-effect and significant cis- trans- interaction. (C) QTL peak associated with the splice junction chr8_58723765_58725573. (D) Expression patterns for junction chr8_58723765_58725573 associated with four different allelic contributions (two alleles for the marker and two alleles for the junctions, the first letter represents the allele for marker and the second letter represents the allele for junction): BB, BM, MB, and MM. (E) QTL peak associated with the splice junction chr2_185611871_185612044. (F) Expression patterns for splice junction chr2_185611871_185612044 associated with four different allelic contributions two alleles for the marker and two alleles for the junctions, the first letter represents the allele for marker and the second letter represents the allele for junction): BB, BM, MB, and MM.
