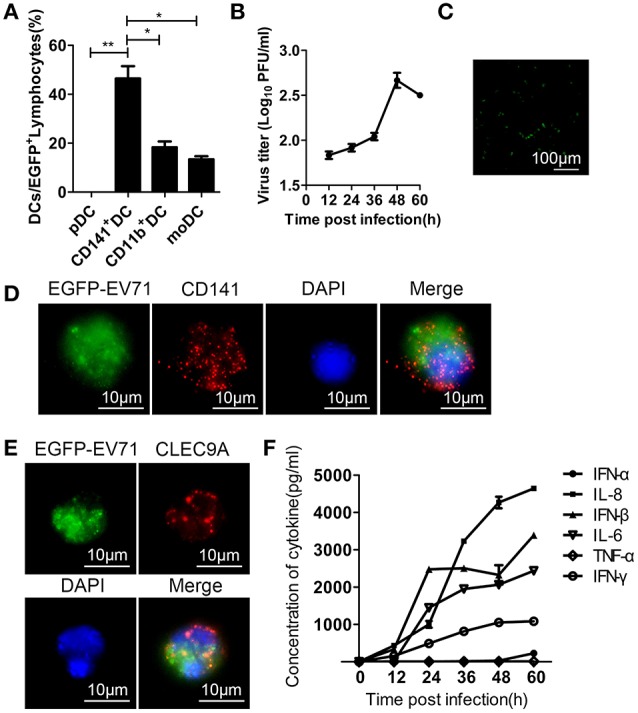
Figure 6.

Assessment of EGFP-EV71 infection of cultured DCs. (A) Flow cytometry was performed to detect the distribution of DC subsets infected by EGFP-EV71 in vitro. The data are presented as the mean ± SD, n = 3; t-test, two-tailed; *p < 0.05, **p < 0.01. (B) Viral titration analysis of EGFP-EV71-infected DCs. The data are presented as the mean ± SD, n = 3. (C) Cultured DCs were infected by EGFP-EV71, and their green fluorescence expression was assessed by fluorescence microscopy. (D–E) In vitro EGFP-EV71-infected CD141+ DCs (red) were labeled with an anti-CD141 antibody (D) and anti-CLEC9A antibody (E). (F) Cytokines detected in the supernatant of EGFP-EV71-infected cultured DCs.
