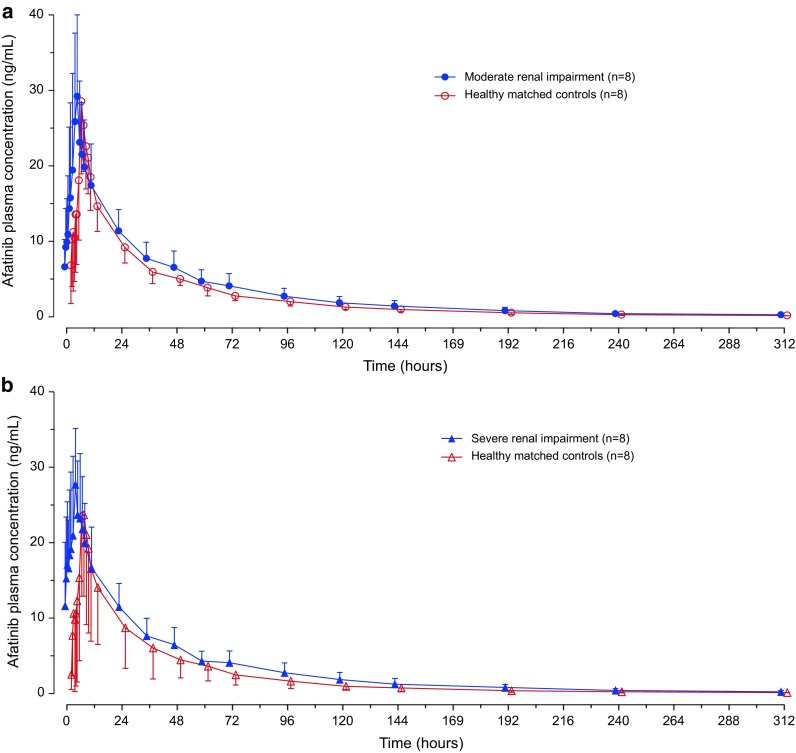
Fig. 1.

Arithmetic mean (± standard deviation [SD]) plasma concentration–time profiles for afatinib following a single 40 mg dose in subjects with moderate (n = 8) (a) and severe (n = 8) (b) renal impairment compared with matched healthy controls (linear scale). For clarity, data points have been shifted on the x-axis to avoid overlap of error bars and only one whisker of SD is shown per group (renal impairment +SD, healthy subjects −SD)
