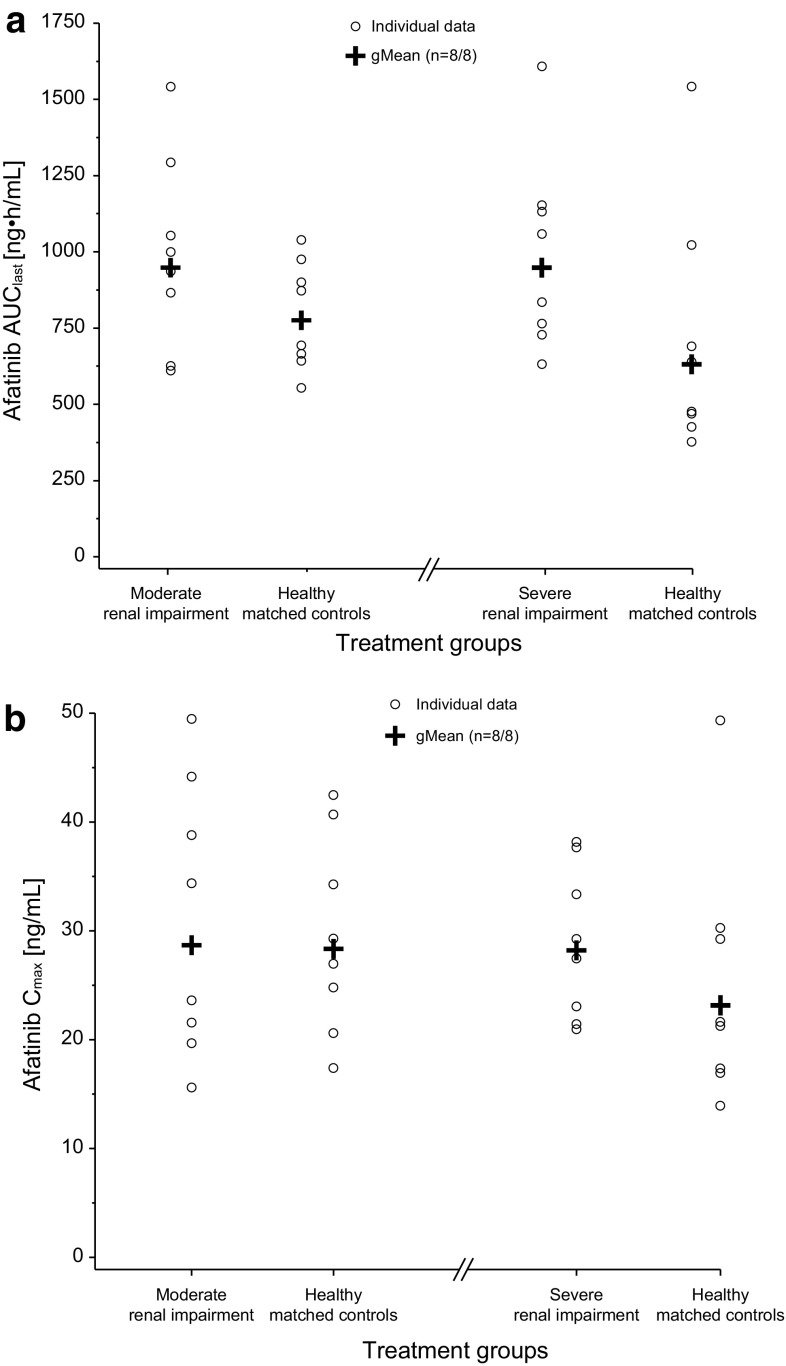
Fig. 2.
Comparison of individual and gMean AUClast (a) and C max (b) in subjects with moderate and severe renal impairment and matched healthy controls. AUC last area under the drug plasma concentration-time curve from time 0 to the time of the last quantifiable data point, C max maximum drug concentration in plasma, gMean geometric mean

