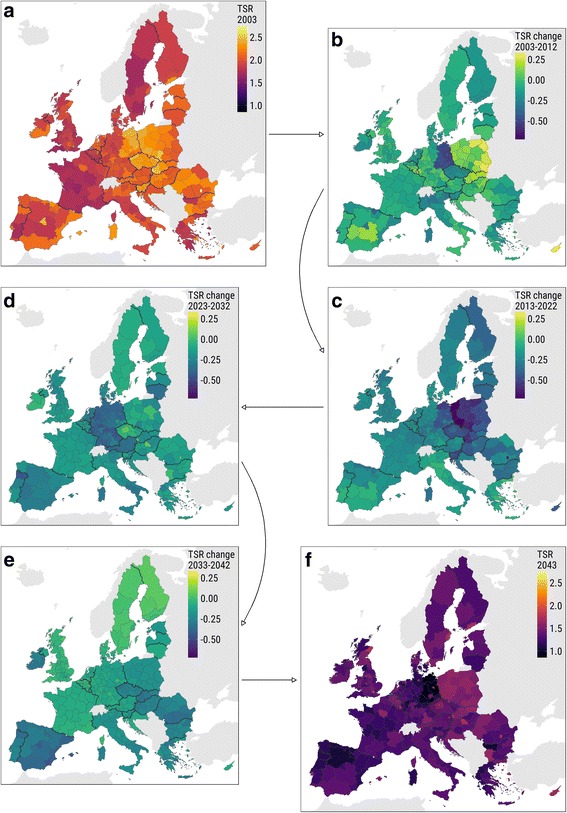
Fig. 1.

Total support ratio dynamics in the four decades between 2003 and 2043. Notes: a TSR in 2003. b TSR growth during the observed period, 2003–2012. c–e TSR growth in the three decades of the projected period, 2013–2022, 2023–2032, and 2033–2042, correspondingly. f TSR in 2043. Color scales are fixed for better comparison: (1) in maps a and f and (2) in maps b, c, d, and e
