
Fig. 3.
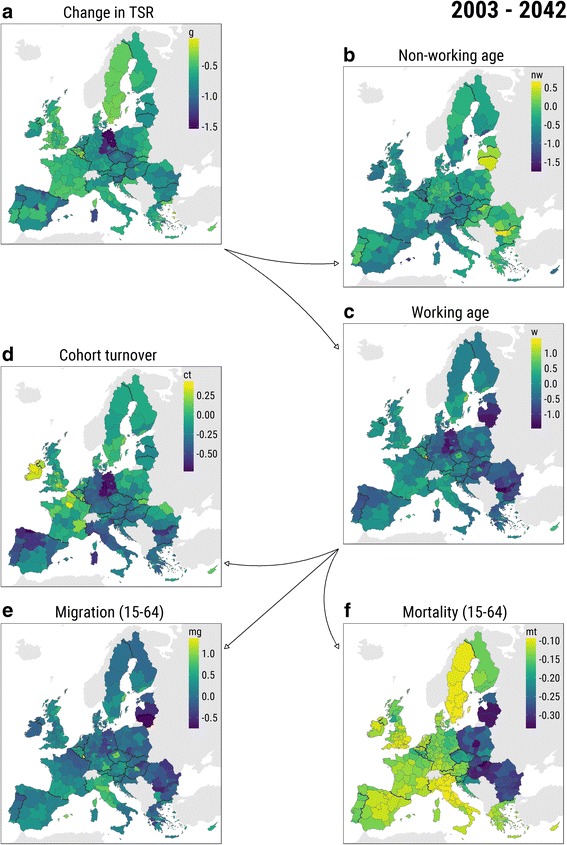
Decomposition of change in TSR between 2003 and 2043. Notes: a Overall change. b Change due to dynamics in non-working-age population. c Change due to dynamics in working-age population. d Change due to cohort turnover. e Change due to migration at working ages. f Change due to mortality at working ages. Color scales are panel specific due to the big difference in variables’ distributions