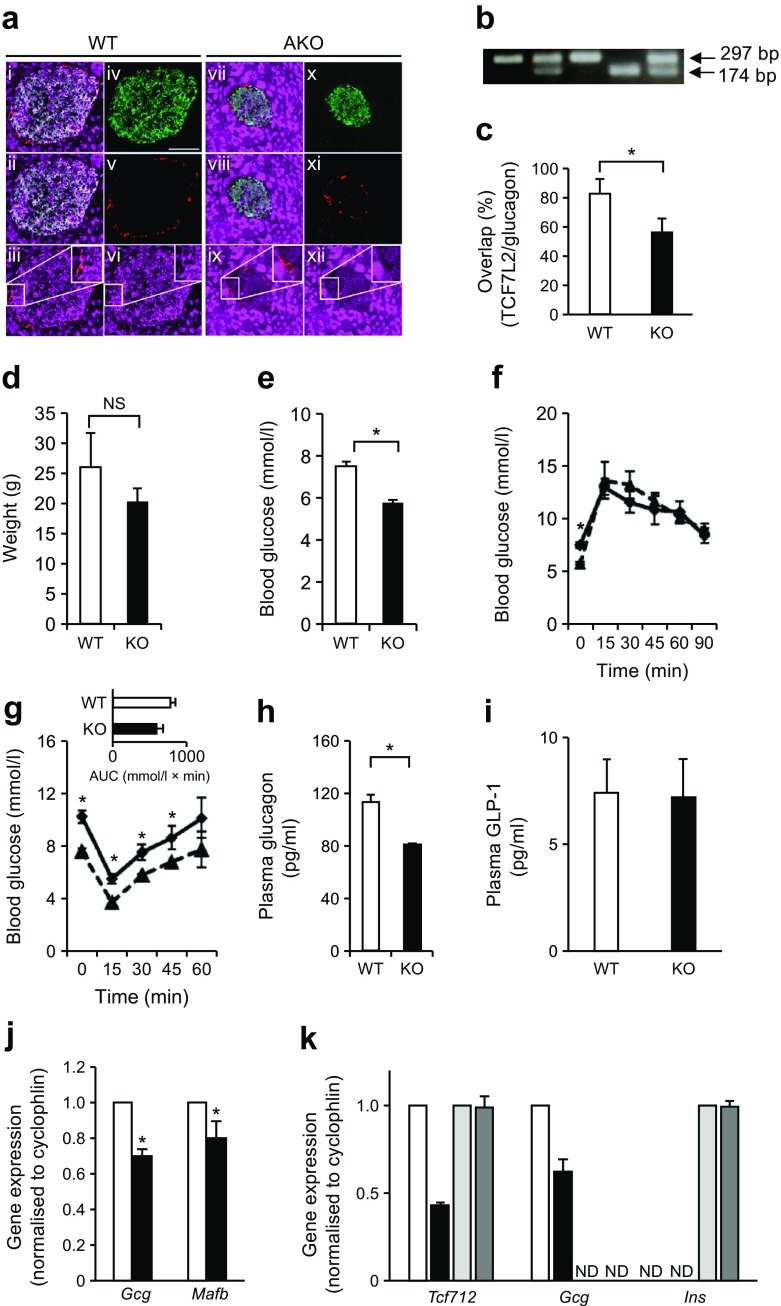
Fig. 1.
Tcf7l2AKO mice display reduced blood glucose, insulin intolerance and plasma glucagon concentration. Tcf7l2 was knocked out using an alpha cell-selective Cre [36]. (a) Representative images of immunohistochemical analysis are shown to confirm knockout by labelling pancreases from wild-type (WT; panels i–vi) and Tcf7l2AKO (panels vii–xii) mice with anti-glucagon (red), anti-insulin (green) and anti-TCF7L2 (magenta) antibodies. Images i and vii show overlay of all three channels, ii and viii show overlay of insulin with TCF7L2, iii and ix show overlay of glucagon with TCF7L2, and iv–vi and x–xii show the individual channels. Inset panels show magnified images of the indicated areas. Scale bar, 50 μm and applies to all micrographs in part (a). (b) PCR genotyping gel to confirm the presence of the wild-type (WT; 174 bp) and conditional knockout (AKO; 297 bp) allele. (c) Graph showing quantification of the degree of overlap between glucagon-positive alpha cells and TCF7L2-positive cells in pancreases from WT and Tcf7l2AKO mice. (d) Tcf7l2AKO mice exhibit normal weight. (e–g) i.p. glucose and insulin tolerance tests were conducted on 8–9-week-old mice on a normal chow diet. (e) Fasting glucose but not (f) overall glucose tolerance was altered in Tcf7l2AKO mice compared with WT mice. (g) Insulin tolerance, (h) fasting (16 h) plasma glucagon and (i) plasma GLP-1 were also measured in Tcf7l2AKO mice. (j) Real-time PCR analysis of islets of Langerhans from 20-week-old Tcf7l2AKO mice and WT littermate control mice on normal chow diet. (k) Real-time quantitative PCR analysis of cells captured by laser microdissection for measurements of the indicated genes. In (a–j): white bars and solid lines, WT mice; black bars and dashed lines, Tcf7l2AKO mice. In (k): white bars, glucagon-positive cells from WT mice; black bars, glucagon-positive cells from Tcf7l2AKO mice; light grey bars, insulin-positive cells from WT mice; dark grey bars, insulin-positive cells from Tcf7l2AKO mice. For (a–i), n = 5; for (j) and (k), n = 3. ND, non-detectable (i.e. Gcg and Ins expression was undetectable in insulin- and glucagon-positive cells, respectively), NS, non-significant. *p < 0.05

