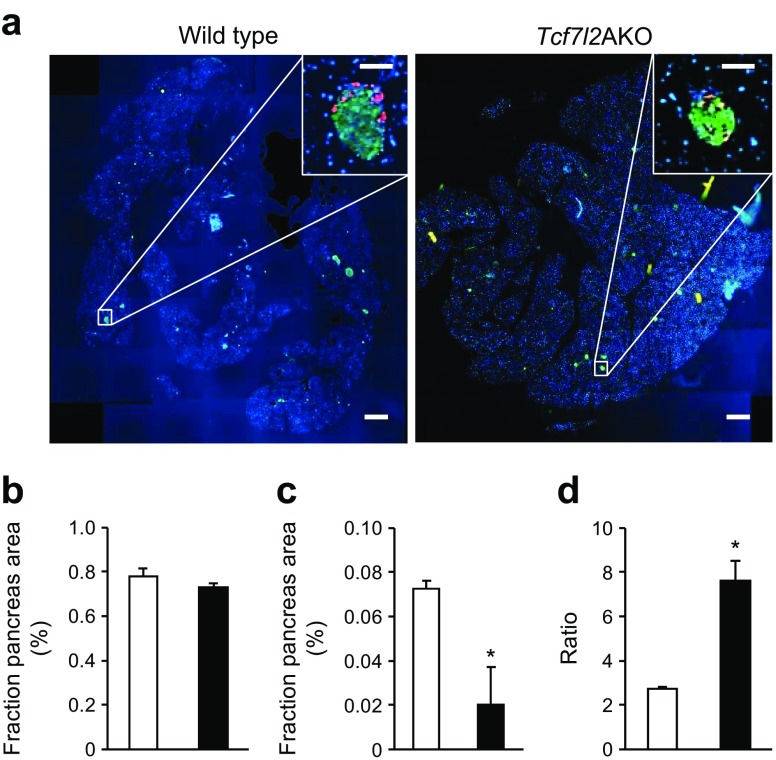
Fig. 3.
Tcf7l2AKO mice display reduced alpha cell mass. (a) Representative images from pancreatic sections from wild-type and Tcf7l2AKO mice are shown. Scale bar in large micrographs, 500 μm; scale bar in insets, 100 μm. (b) Beta cell (defined as insulin-positive cells, in green) and (c) alpha cell (defined as glucagon-positive cells, in red) mass, and (d) beta/alpha cell ratio from 20-week-old mice were quantified [44]. White bars, wild-type mice; black bars, Tcf7l2AKO mice. n = 7 mice for all; *p < 0.05

