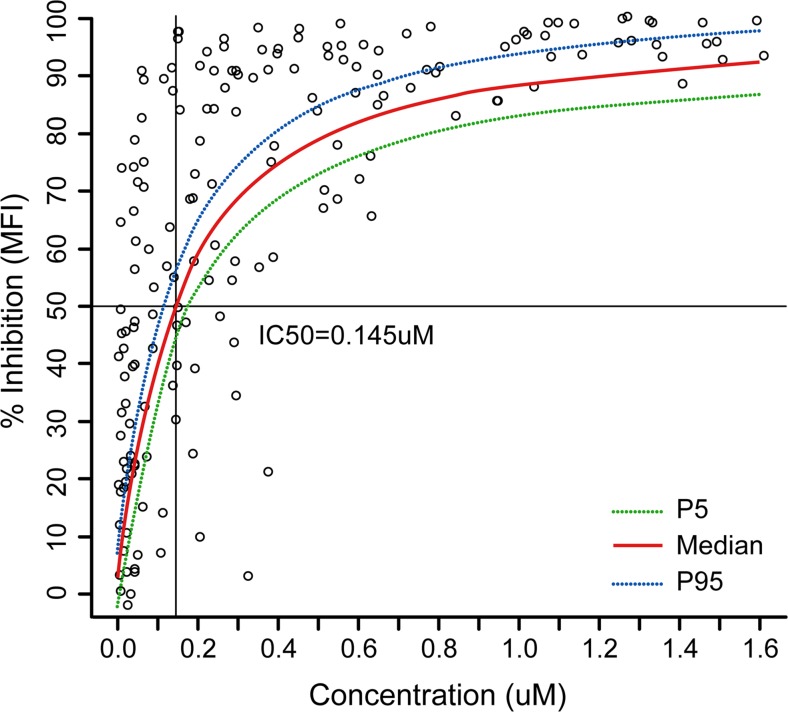
Fig. 4.
BMS-986142 plasma concentration and CD69% inhibition relationship curve. Data included participants with matching concentration of BMS-986142 and CD69 inhibition. Placebo participants were excluded from the analysis. Data excluded values of CD69% inhibition >100 or ≤−100. For illustration purposes, Y-axis only presented from 0 to 100%. IC50 = BMS-986142 concentration to inhibit the 50% of CD69 expression

