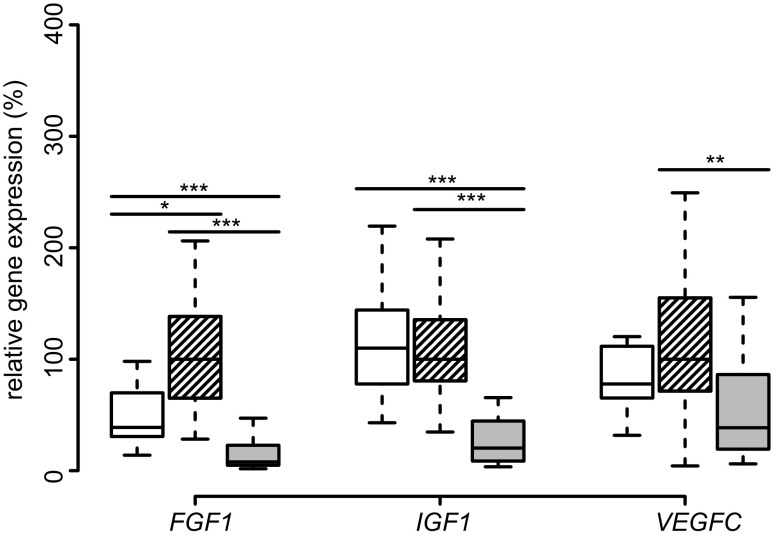
Fig. 4.
SAT expression of growth factors. Boxplots of FGF1, IGF1, VEGFC expression in SAT of lean (white), obese (hatched), and post-obese (gray) subjects are presented. Comparisons were made between lean-obese, obese-post-obese, and post-obese-lean subjects by Tukey’s test. *p < 0.05; **p < 0.01; ***p < 0.001

