Figure 2.
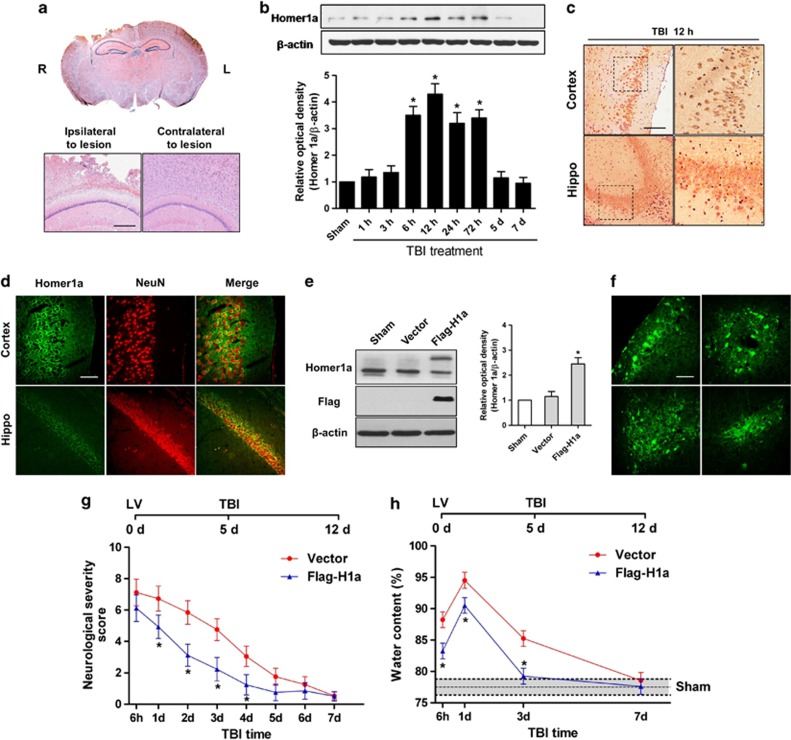
Homer 1a is neuroprotective in vivo. TBI was induced in mice. H&E staining was performed on traumatically injured brain tissue (a). Scale bar=200 μM. The expression of Homer 1a was measured by western blot analysis at the indicated times (b). The data are represented as the mean±S.E.M. from five experiments. *P<0.05 versus control. Immunohistochemistry staining for Homer 1a in the area surrounding the lesion (c). Scale bar=100 μM. The distribution of Homer 1a is revealed by immunofluorescence staining for Homer 1a and NeuN (d). Scale bar=40 μm. Mice were injected with vector or Flag-H1a, and the expression of Homer 1a was measured by western blot analysis (e). The data are represented as the mean±S.E.M. from five experiments. *P<0.05 versus vector. Immunofluorescence staining for Flag in an area injected with Flag-H1a (f). Scale bar=40 μm. TBI was induced in mice injected with vector or Flag-H1a. The neurological functions in the vector group (n=10) and the Flag-H1a group (n=12) were assessed by determining the NSS at 6 h and 1, 2, 3, 4, 5, 6, and 7 days after TBI (g). The extent of brain edema in the vector group (n=10) and the Flag-H1a (n=10) group was measured by water content tests at 6 h, 1 d, 3 d, and 7 days (h). The data are represented as the mean±S.E.M. *P<0.05 versus vector

