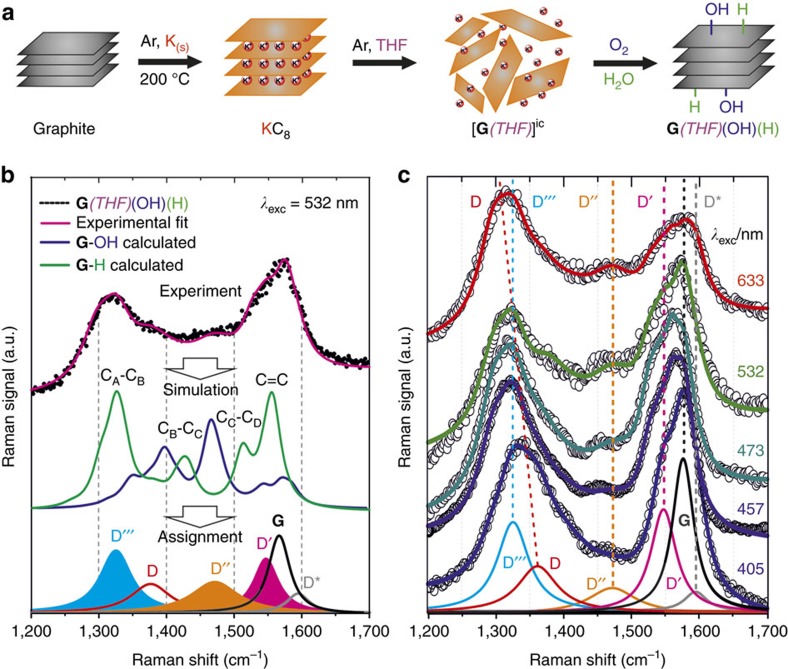
Figure 3. Raman bands in bulk functionalized samples.
Raman spectroscopy of a bulk functionalized graphene derivative G(THF)(OH)(H) as a model of GO without σ-defects45. (a) Reaction scheme for the hydrogenation and hydroxylation of charged graphenides followed by workup under ambient conditions (O2/H2O). (b) Raman D- to G-mode area of G(THF)(OH)(H) together with the corresponding calculated spectra for G-OH (blue) and G-H (green). The combination of experiment and theory leads to a precise assignment of each Raman mode. Besides the D, D* and G modes arising from excitations at the K point, the Raman fingerprint of covalently functionalized (here: -OH and -H) lattice carbon atoms can be revealed by identifying the modes D''', D'' and D'. (c) Raman analysis with varying laser excitation wavelengths: 405 to 633 nm. Every mode but the D mode is nondispersive (excitation at the Γ point) as expected in relation to the Raman fingerprint obtained in Fig. 1. The determined Raman shifts for the individual components are summarized in Supplementary Table 1.

