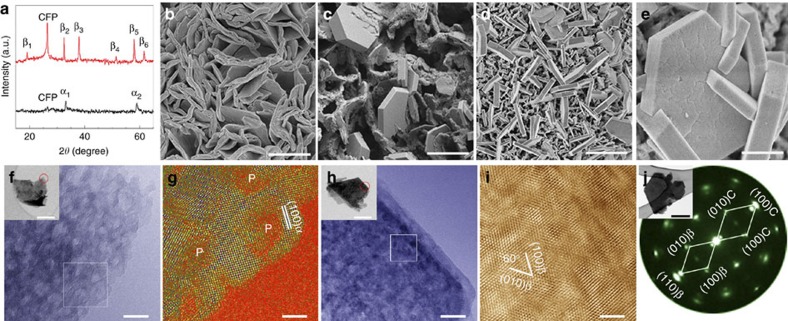
Figure 1. Characterization of Co(OH)2 before and after in situ XAS experiment.
(a) X-ray diffraction patterns of as-prepared Co(OH)2, α1 and α2 are indexed to α-Co(OH)2 (100) and (110) (PDF, card No. 46-0605), and Co(OH)2 after bathing in 1 M KOH for 15 min, β1–β6 are indexed to (001), (100), (101), (102), (110) and (111) (PDF card No. 30-0443), respectively. (b–e) SEM images of as-prepared Co(OH)2, Co(OH)2 after bathing in KOH and after in situ XAS. Scale bars, 2 μm, 2 μm, 2 μm and 400 nm, respectively. (f–j) TEM images of Co(OH)2 and Co(OH)2 after in situ XAS. (f,h) High-resolution TEM (HRTEM) images of the areas marked by the red circles in the insets. Scale bars, 10 nm and the inset scale bars, 200 nm. (g,i) HRTEM images that are highlighted by a white square in f,h, respectively. Scale bars, 3 nm. (j) A local selected area electron diffraction pattern of Co(OH)2 after in situ XAS. The inset scale bar, 0.5 mm.

