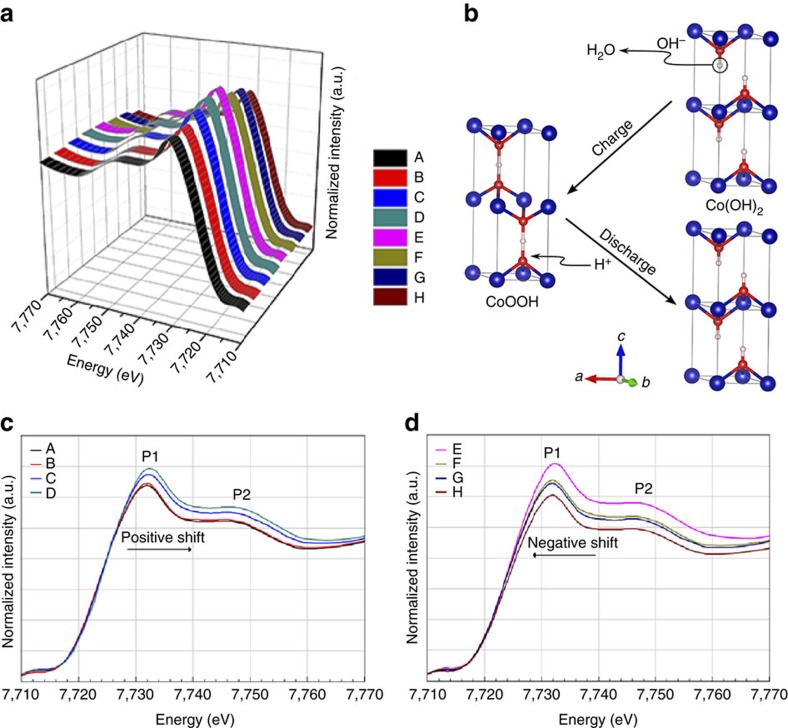
Figure 3. Comparison of in situ XANES collected on the electrode and the reaction model of Co(OH)2 and CoOOH transformation.
(a) In situ XANES spectra of a whole charge/discharge cycle in a three-dimensional mode. A–H spectra correspond to the positions marked in Fig. 2c. (b) The reaction model of Co(OH)2 and CoOOH phase transformation. Co(OH)2 loses a hydrogen to becomes CoOOH during charge, and vice versa, a hydrogen is incorporated into CoOOH during discharge. (c) In situ XANES spectra of the charge process. (d) In situ XANES spectra of the discharge process.

