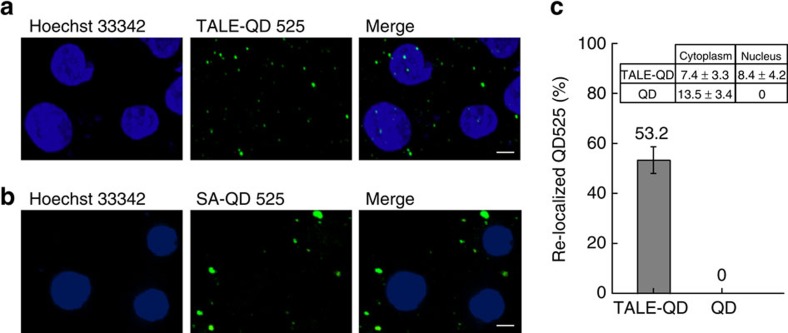
Figure 5. Biotin–streptavidin labelling to generate QD-TALEs in live cells.
(a) Confocal images showing TALE N2-R labelled with QD525 in live U1 cells. (b) Confocal images showing SA-QD525 transfected into a live cell. Scale bar, 5 μm. (c) Percentage of QD525s (2,000 QD525s in 129 cells) with or without attachment to TALE re-localized to the nucleus. Inset: Count and statistics of QD525 with or without attachment to TALE in the cytoplasm and nucleus. Error bars denote s.d.; n=129.

