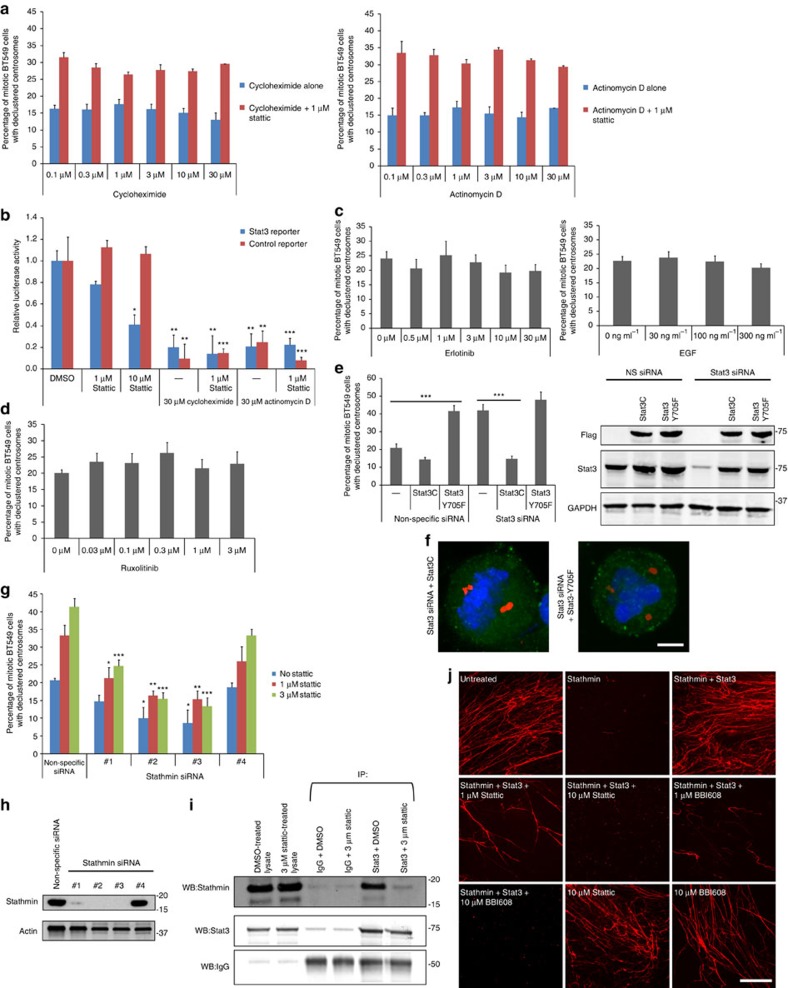
Figure 3. Stat3 induces centrosome clustering via Stathmin and is independent of Stat3 transcription factor function.
(a) Quantification of centrosome declustering in BT-549 cells treated with the protein synthesis inhibitor cycloheximide (left panel; n=5 biological replicates, ≥1,000 cells per data point) and the transcription inhibitor actinomycin D (right panel; n=5 biological replicates, ≥1,000 cells per data point). (b) Transcriptional reporter activity of cells treated with Stattic, cycloheximide or actinomycin D. n=4 biological replicates. Statistical significance was tested between untreated and compound-treated groups with analysis of variance (ANOVA). (c) Quantification of centrosome declustering in mitotic BT-549 cells treated with epidermal growth factor (EGF; left; n=5 biological replicates, ≥1,000 cells per data point) or the EGF receptor inhibitor erlotinib (right; n=5 biological replicates, ≥1,000 cells per data point). Statistical significance was tested between untreated and compound-treated groups with ANOVA. (d) Quantification of centrosome declustering in BT-549 cells treated with the Jax1/2 inhibitor ruxolitinib. n=5 biological replicates, ≥1,000 cells per data point. Statistical significance was tested between untreated and ruxolitinib-treated groups with ANOVA. (e) Left: quantification of centrosome declustering in Stat3 siRNA-treated mitotic BT-549 cells stably expressing Flag-Stat3C or Flag-Stat3-Y705F (n=5 biological replicates, 250 cells per condition). Right: western blot of Flag, Stat3 and GAPDH (loading control) using lysates from Stat3 siRNA-treated cells stably expressing Flag-Stat3C or Flag-Stat3-Y705F. Statistical significance between the indicated groups was tested using ANOVA. (f) Immunofluorescence images of Stat3 siRNA-treated BT-549 cells stably expressing Flag-Stat3C (left) or Flag-Stat3-Y705F (right). Pericentrin (red), Flag (green) and DNA (Hoechst, blue). Scale bar, 4 μm. (g) Quantification of centrosome declustering in BT-549 cells treated with Stathmin siRNA±Stattic. n=4 biological replicates, ≥800 cells per condition. Statistical significance was tested between untreated and Stattic-treated groups with ANOVA. (h) Western blot of Stathmin and actin (loading control) using lysates from Stathmin siRNA-treated cells. (i) Immunoprecipitation of IgG (control) or Stat3 from BT-549 cells using endogenous protein and western blotted for Stathmin, Stat3 and IgG. (j) In vitro tubulin polymerization assay using purified proteins. Microtubules were grown in the presence of the microtubule depolymerase Stathmin (HIS-tagged), Stat3 (GST-tagged), Stattic and BBI-608. HIS-Stathmin and GST-Stat3 were used at 1.8 and 0.36 μM concentrations, respectively. Scale bar, 8 μm. *P<0.05; **P<0.01; ***P<0.001. Error bars represent s.e.m.

