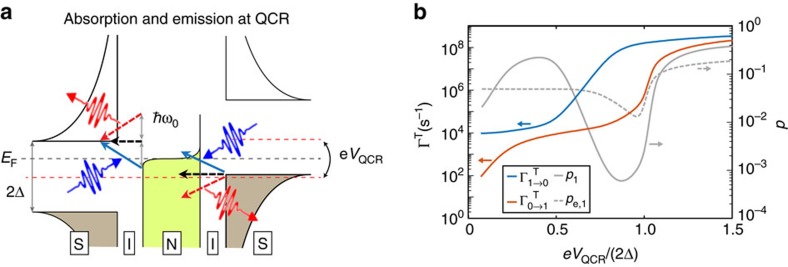
Figure 2. Electron tunnelling events and the resulting resonator transition rates.
(a) Schematic energy diagram illustrating sequential single-electron tunnelling events in the QCR: elastic tunnelling (black arrows), photon absorption from the resonator (blue arrows) and photon emission to the resonator (red arrows). The beginning of a straight arrow denotes the initial energy (vertical axis) and location (S or N) of the electron that tunnels, and the head of the arrow points to the final energy and location. The wavy arrows illustrate the photons absorbed (blue) and emitted (red) by the electrons. The coloured regions denote the occupied states and the white regions correspond to empty or absent states. The absence of states occurs at the insulators (I) and in the energy gap of size 2Δ at the superconductor. The dashed arrows indicate tunnelling processes which are forbidden owing to no occupancy at the initial energy level or no vacancy at the final level. Although tunnelling takes place at a multitude of different energy levels, we only show the most likely events of each kind which either initiate or terminate at the edge of the superconductor energy gap where the density of states (black solid line at S) ideally diverges. The dashed lines show the Fermi levels of the normal metal (black, EF) and of the superconductors (red). The work done by the voltage source in the course of an electron tunnelling event through the whole structure, eVQCR, is depicted as corresponding shifts of the Fermi levels. (b) Relaxation ( , blue line) and excitation (
 , red line) rates of the fundamental mode of the resonator and the corresponding steady-state excitation probability
  (grey line) as functions of the QCR operation voltage, VQCR. The rates are calculated from the P(E) theory (Supplementary Note 3) using the experimentally realized parameter values for the active sample and the two-state approximation. Supplementary Fig. 3 shows corresponding results for optimized parameters. The grey dashed line shows the excited-state population assuming that the resonator temperature equals that of the normal-metal electrons of the QCR.

