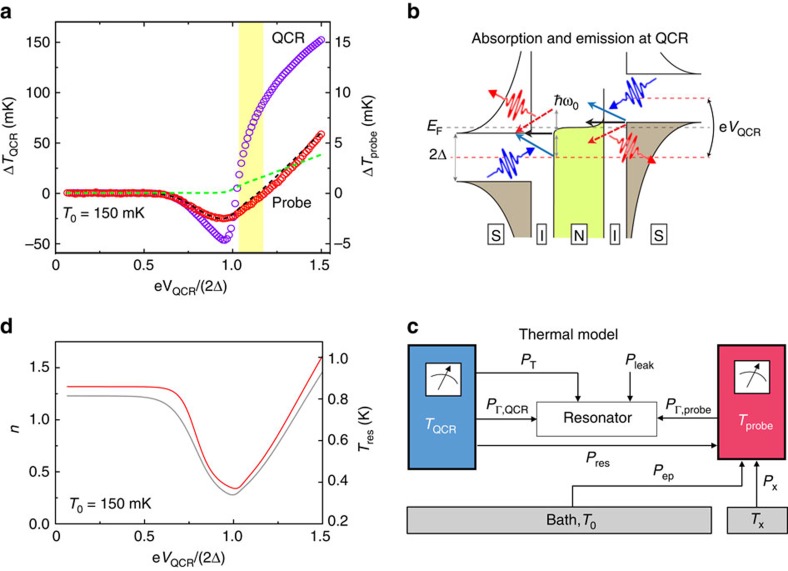
Figure 3. Quantum-circuit refrigeration and thermal model.
(a) Experimentally measured changes in the electron temperatures of the QCR, ΔTQCR (purple circles) and of the probe resistor, ΔTprobe (red circles), as functions of the refrigerator operation voltage VQCR. The dashed lines show the theoretical ΔTprobe with (black) and without (green) photon-assisted tunnelling. (b) Tunnelling diagram similar to that in Fig. 2a, but for a higher operation voltage corresponding to the region highlighted in yellow in a. Here only photon emission to the resonator is suppressed by the lack of thermal excitations. (c) Thermal model used for the experiment. Blue colour denotes the electron system of the QCR and red colour that of the probe resistor. Only the fundamental mode of the resonator is considered. The power PT arises from photon-assisted tunnelling;  and
and  correspond to ohmic losses; Pep accounts for coupling between the probe electrons and the phonon bath at temperature T0; Pres denotes the residual heating power of the probe due to VQCR; Pleak accounts for leakage of photons to the resonator from high-temperature stages of the cryostat; and Px denotes excess power due to a constant thermal conductance Gx to a reservoir at temperature Tx. Negative power implies the opposite direction of the energy flow with respect to the shown arrows. See Supplementary Note 2 for a detailed description of the model. (d) Resonator temperature (Tres, grey line) and average photon number (n, red line) solved from a thermal model corresponding to the measurements in a. See Supplementary Note 6 and Supplementary Fig. 4 for more information and for data at different bath temperatures.

