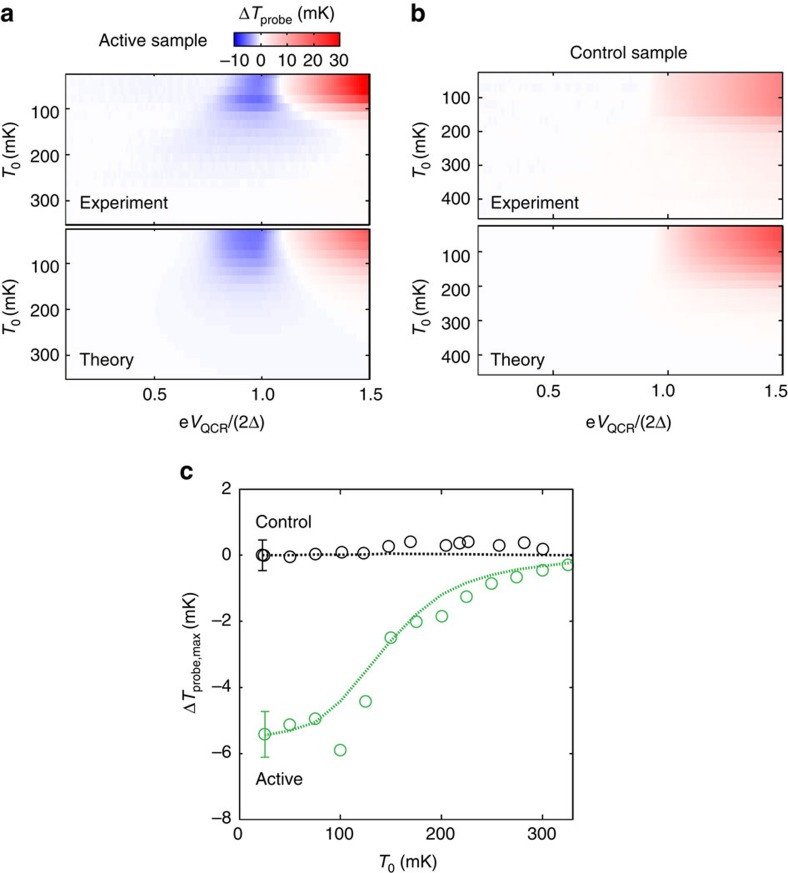
Figure 4. Comparison between the active sample and the control sample.
(a,b) Temperature change of the probe, ΔTprobe, as a function of the QCR operation voltage and the bath temperature for experimental and simulated data in the case of the active sample (a) and the control sample (b). (c) Temperature changes of the probe from the active sample (green circles, extracted from a) and from the control sample (black circles, extracted from b) as functions of the bath temperature at the operation voltage corresponding to the maximum cooling point of the probe and the QCR, respectively. Dashed lines show the corresponding data obtained from the thermal model. The error bars indicate the maximum s.d. for each data set.

