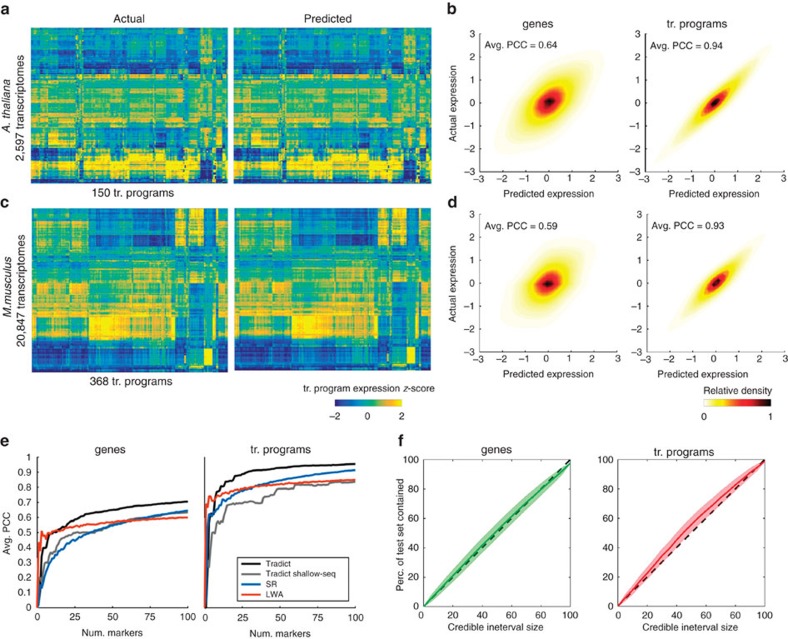
Figure 3. Tradict prospectively predicts gene and transcriptional program expression with superior and robust accuracy.
Tradict's prospective prediction accuracy during 20-fold cross validation of the entire training collection for both organisms. (a) Heatmaps illustrating test-set reconstruction performance of all transcriptional programs for A. thaliana. Shown is the reconstruction performance for all samples in our transcriptome collection when they were in the test-set. (b) Density plots of predicted versus actual test-set expression for all genes (left) and transcriptional programs (right) for A. thaliana, after controlling for inter-sumbission biological signal. The intra-submission expression of each gene and transcriptional program was z-score transformed to make their expression comparable. (c,d) Same as (a,b), but for M. musculus. (e) Comparison of Tradict's performance versus several baselines: SR, LWA and Tradict Shallow-Seq. (f) A posterior predictive check illustrating the concordance between Tradict's posterior predictive distribution and the distribution of test-set expression values for genes (left) and transcriptional programs (right). Plotted is the percent of test-set observations contained within a credible interval versus the size of the credible interval. A unique credible interval is derived for each gene/program. The ‘x=y' line is illustrated as a dotted black line. Shaded error bands depict the sampling distribution of this analysis across test-sets from a 20-fold cross validation on the A. thaliana data set.

