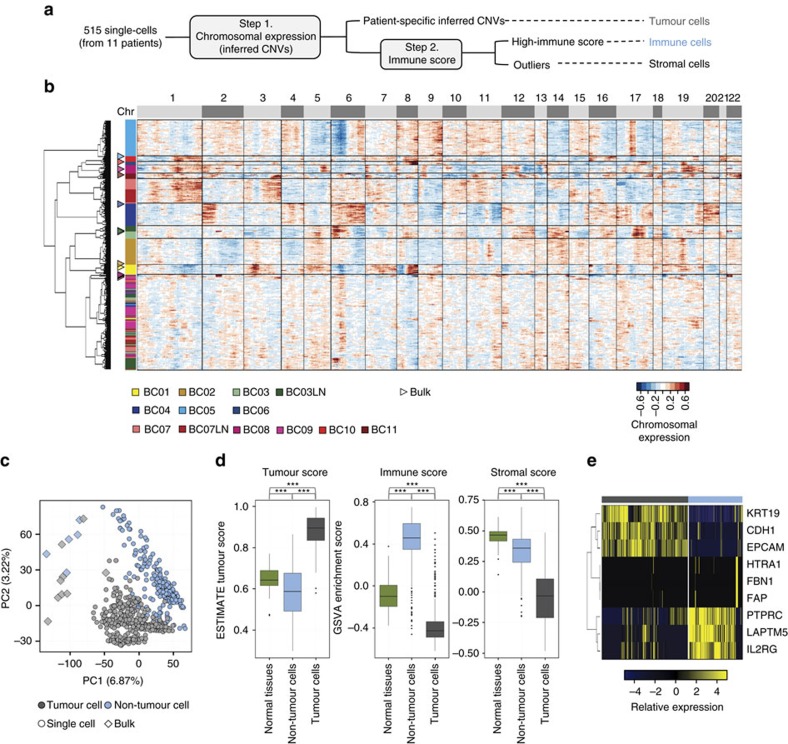
Figure 2. Separation of carcinoma and non-carcinoma cells.
(a) Scheme of cell classification. (b) Hierarchical clustering of the chromosomal gene expression pattern separating the patient-specific carcinoma cell groups from the non-carcinoma cell cluster. Each row represents single cells and matched bulk tumours (triangle): the tumour groups are colour-coded as in Fig. 1a. For each chromosome, the chromosomal gene expression pattern was estimated from the moving average of 150 genes. These patterns implicate chromosomal amplification and deletion. (c) Unsupervised PCA showing the separation of carcinoma and non-carcinoma cell groups. (d) Carcinoma cells identified in a, scored low for stromal and immune signatures, whereas non-carcinoma cells scored high for immune signatures. Tumour score was inferred from the stromal and immune signature using ESTIMATE algorithm26. Normal tissues represent 183 mammary tissue data from GTEx portal (http://www.gtexportal.org/). Each box shows the median and interquartile range (IQR 25th–75th percentiles), whiskers indicate the highest and lowest value within 1.5 times the IQR and outliers are marked as dots. P value, Student's t-test (***P<0.001). (e) Representative gene expression in single cells for the immune (PTPRC, LAPTM5 and IL2RG), stromal (HTRA1, FBN1 and FAP) and epithelial (KRT19, CDH1 and EPCAM) cell types.

