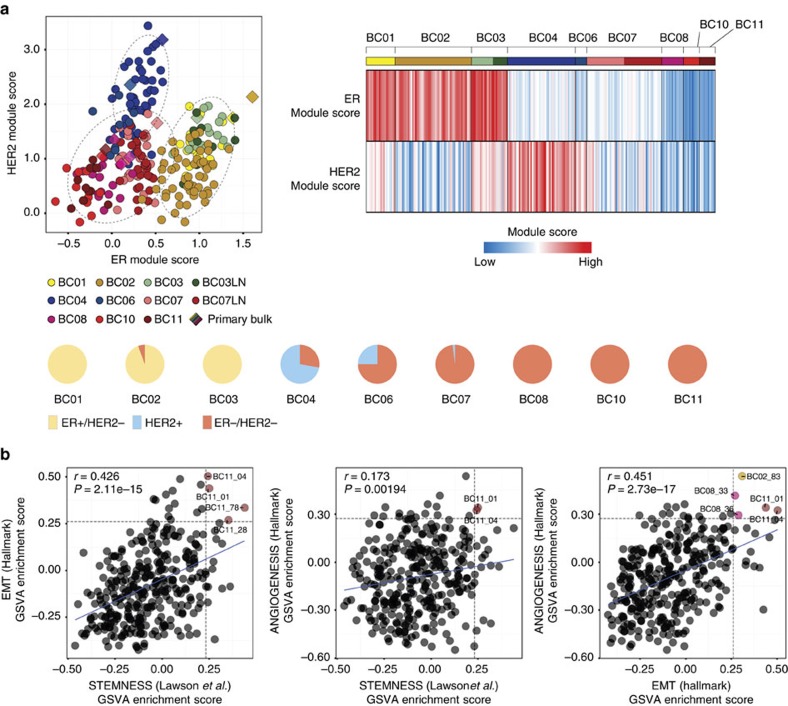
Figure 4. Intrinsic tumour cell heterogeneity.
(a) Subtype prediction of tumour cells as ER+, HER2+ or TNBC types using ER and HER2 module scores50 (R software package genefu, top left panel). Heatmap of subtype-specifying module scores (top right) and pie charts (bottom) demonstrating Intratumoral subtype heterogeneity in HER2 tumours. (b) Pearson's correlation coefficient (r) between aggressive cancer gene expression signatures (EMT, stemness and angiogenesis). Horizontal and vertical dashed lines indicate signature score cut-offs at top 5%. The linear regression result is drawn as a solid line. The coloured dots mark cells with high expression signatures for both axis.

