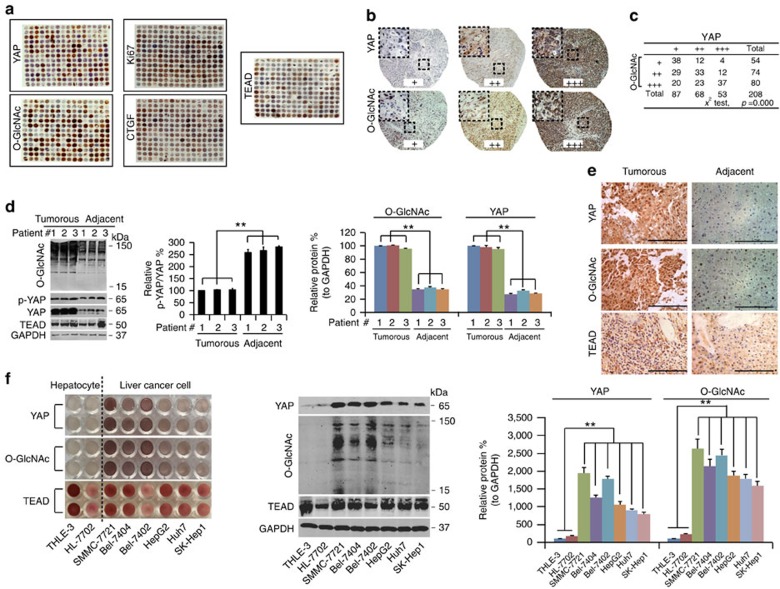
Figure 1. YAP expression is associated with global O-GlcNAcylation in liver cancer tissues and established liver cancer cell lines.
(a–c) TMA of YAP, Ki67, O-GlcNAc, CTGF and TEAD. IHC images of TMA stained with anti-YAP, anti-Ki67, anti-CTGF, anti-TEAD and anti-O-GlcNAc antibody, (a). Enlarged IHC images of YAP and O-GlcNAc staining from the TMA (b). The data were analysed using a chi-square test (c). (d–f) O-GlcNAc and YAP expression in liver cancer and established cell lines. Western blots of O-GlcNAc, TEAD, p-YAP and YAP in liver cancer and adjacent normal liver tissues. The levels of p-YAP were normalized to those of YAP. In addition, the levels of O-GlcNAc and YAP were normalized to those of GAPDH. The levels of the #1 sample of liver cancer were arbitrarily set to 100% (d). Representative images of IHC staining of YAP, TEAD and O-GlcNAc in liver cancer and adjacent normal liver tissues. Scale bar, 500 μM. The liver cancer and normal liver tissue samples are paired (e). YAP and TEAD expression and O-GlcNAc levels in established hepatocyte (THLE-3 and HL-7702) and the indicated liver cancer cell lines detected by IHC and WB, respectively. The levels of YAP and of O-GlcNAc were normalized to those of GAPDH, and the levels of the THLE-3 cells were arbitrarily set to 100% (f). The data are shown as the means+s.d. from three independent experiments (including WB). **P<0.01 indicates statistical significance. Data in c,d,f were analysed using a χ2 test, two-way and one-way ANOVA tests, respectively.

