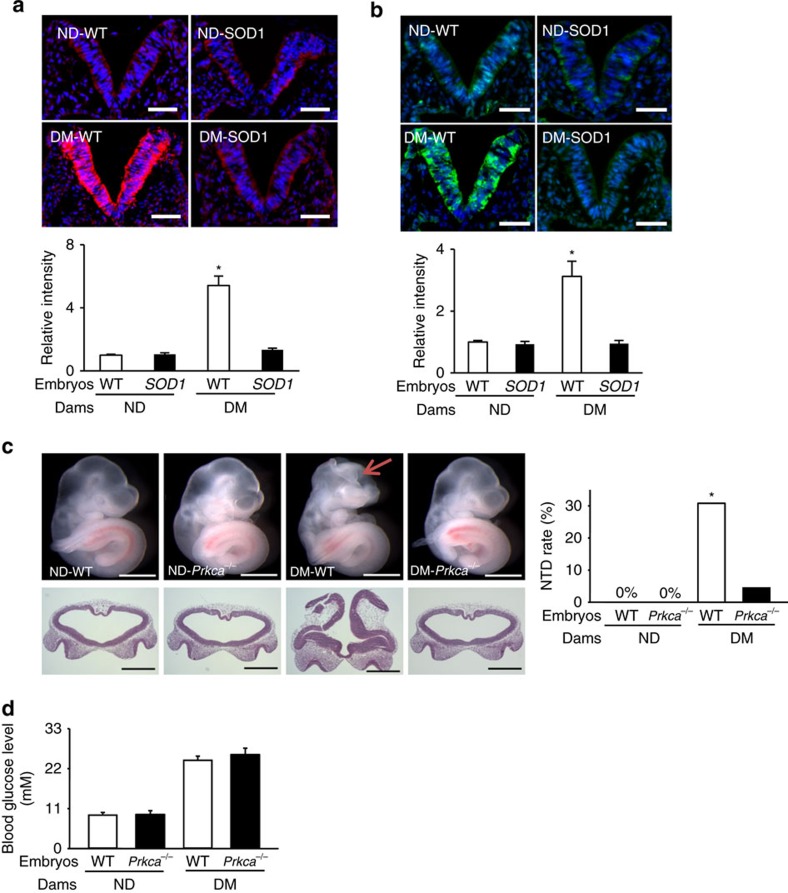
Figure 3. SOD1 blocks diabetes-induced ROS and Prkca deletion ameliorates diabetes-induced NTDs.
Dihydroethidium (DHE) staining and quantification for superoxide (a) and immunostaining of phosphorylated PKCα (b) in the E8.75 neuroepithelium (the V shape structure) of embryonic sections. All cell nuclei were stained with DAPI (blue). Scale bars=70 μm. In a,b three embryos from three different dams in each group were analysed and quantified by fluorescence intensity using the ImageJ software (N=3). (c) Morphology of E10.5 embryos from ND WT, ND Prkca−/−, DM WT and DM Prkca−/− mice, and NTD rates in E10.5 embryos. Scale bars=1 mm. The red arrow indicates exencephaly. Lower panel: frontal sections of embryos in the upper panel showing an open neural tube. (d) Blood glucose concentrations. N for c,d, the numbers (N) of embryos per condition and statistical analyses are indicated in Supplementary Table 1. DM, diabetic mellitus; ND, nondiabetic; WT, wild-type. *indicates significant difference (P<0.05) compared with the ND groups in one-way ANOVA followed by Tukey tests (a,b) and chi-square tests (c).

