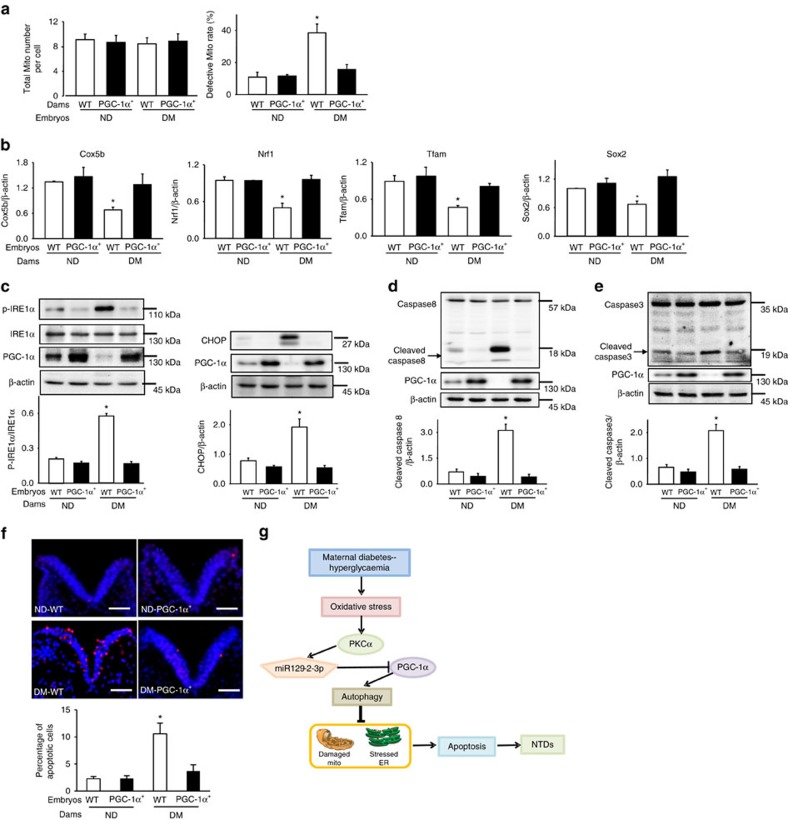
Figure 9. PPARGC1A overexpression prevents diabetes-induced cellular organelle stress and apoptosis.
(a) Total number of mitochondria (Mito) and percentages of defective mitochondria (number of defective Mito divided by total number of Mito) from wild-type (WT) and PGC-1α overexpressing embryos. PGC-1α transgenic males mated with nondiabetic (ND) and diabetic (DM) females to generate WT and PGC-1α overexpressing embryos. (b) mRNA abundance of mitochondrial genes in whole embryos: Cox5b, Nrf1, Tfam, Sox2. Protein abundance of p-IRE1α and CHOP (c), cleaved caspase 8 (d) and caspase 3 (e) in E8.75 embryos. Bar graphs for protein abundance were quantitative data from three independent experiments. Representative images of the TUNEL assays in E8.75 embryos (f). Apoptotic cells were labelled in red and nuclei were labelled by DAPI in blue. The dense blue V shape areas are the neural plates. The level of the body axis was at hindbrain level. The bar graph showed the quantification of apoptotic cell number. Experiments were repeated using five embryos (N=5) from different dams and five images were obtained from each embryo. Scale bars are 30 μm. In a–e experiments were repeated three times using embryos from three different dams (N=3) per group. *indicates significant differences (P<0.05) compared to the other groups in one-way ANOVA followed by Tukey tests. (g) is a schematic diagram depicting the maternal diabetes-induced pathway, PKCα-miR-129-2-PGC-1α, in autophagy impairment leading to mitochondrial dysfunction, ER stress, apoptosis and NTD formation. PKCα upregulates miR-129-2, which in turn downregulates PGC-1α. PKCα and miR-129-2 suppress autophagy whereas PGC-1α stimulates autophagy.

