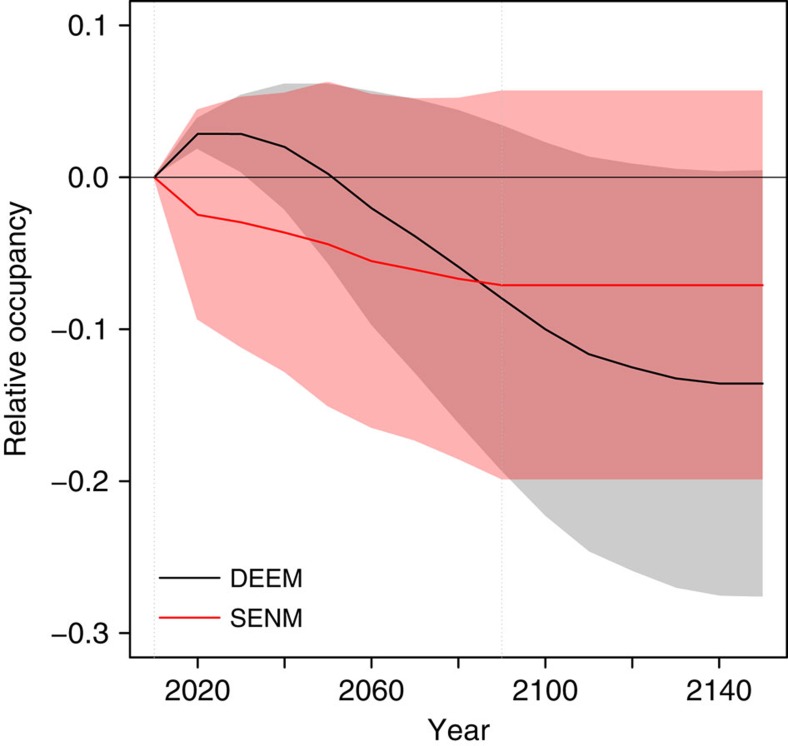
Figure 1. Predicted change in occupancy as a function of time.
The change in occupancy is measured relative to the initial occupancy in 2010, and is calculated as (number of cells occupied in year t−number of cells occupied in 2010)/number of cells occupied in 2010. Lines and coloured areas: mean and s.d. over all species, grids, climate scenarios, selection strengths and mutation rates investigated.

