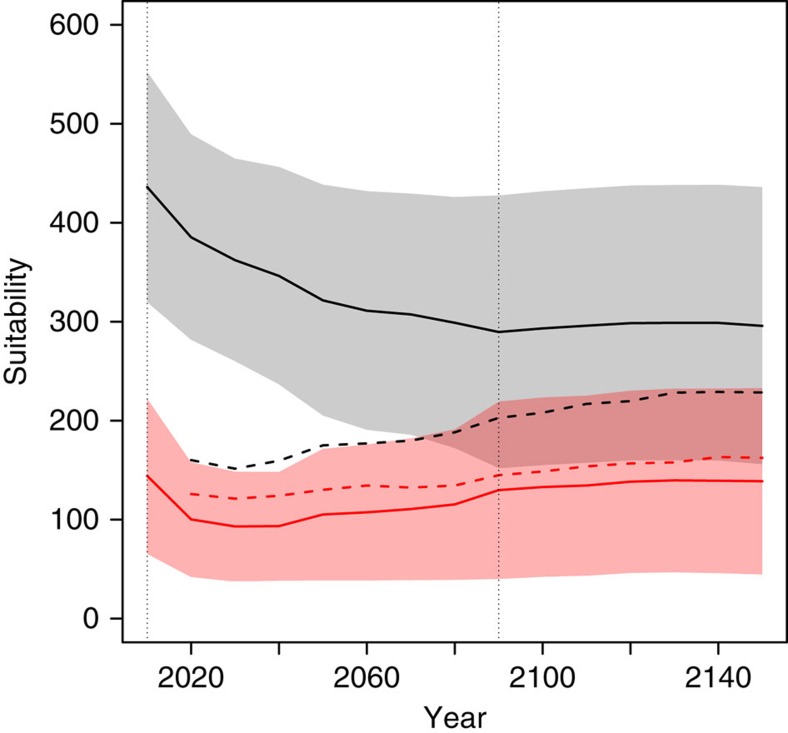
Figure 2. Mean site suitability in the DEEM simulations.
Suitability is predicted by the SENMs and corresponds to the probability of presence × 1,000. Solid lines show the suitability in occupied (black) and unoccupied sites (red) in the DEEMs. The dashed lines show the suitability in the sites colonized (black) and extinct (red) relative to the population state in 2010. For the DEEM predictions after 2090, we used the suitability from the SENMs in 2090 since the climate was assumed constant between 2090 and 2150.

