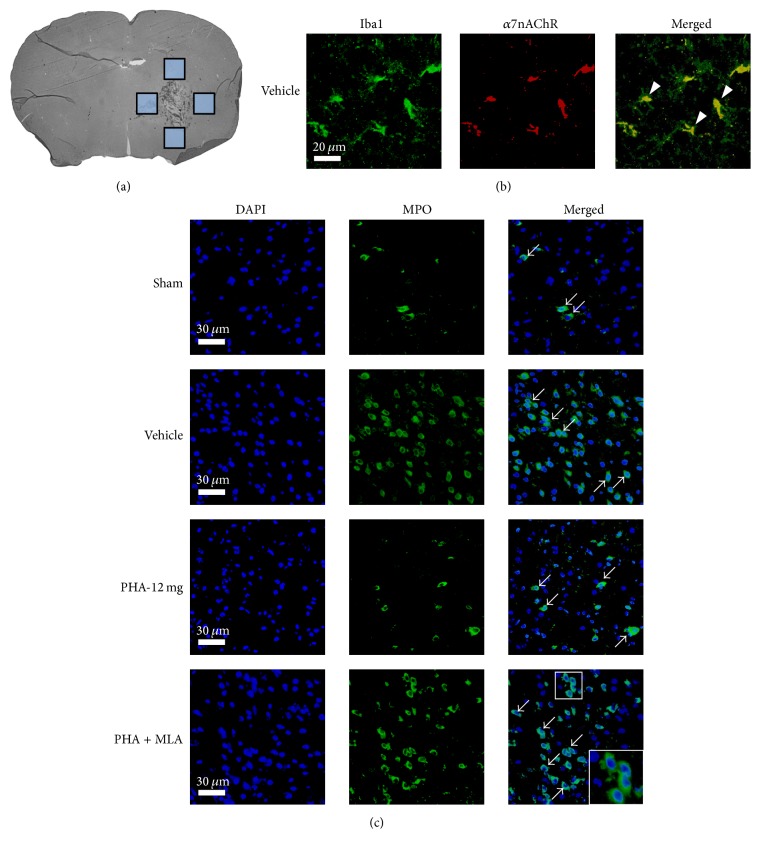
Figure 2.
(a) Brain slice indicating the evaluated perihematomal areas (boxes). (b) Representative photomicrographs of perihematomal tissue localization of the α7 nicotinic acetylcholine receptor (α7nAChR, red) with microglia (Iba1, green). Colocalization of α7nAChR with Iba1 is shown in the merged image (yellow, indicated by arrowheads). Scale bar = 20 μm. (c) Representative photomicrographs of perihematomal tissue with infiltrating neutrophils (MPO, green). Arrows indicate the relative changes in the number of neutrophils infiltrating for each experimental group. Scale bar = 30 μm. n = 3/group.

