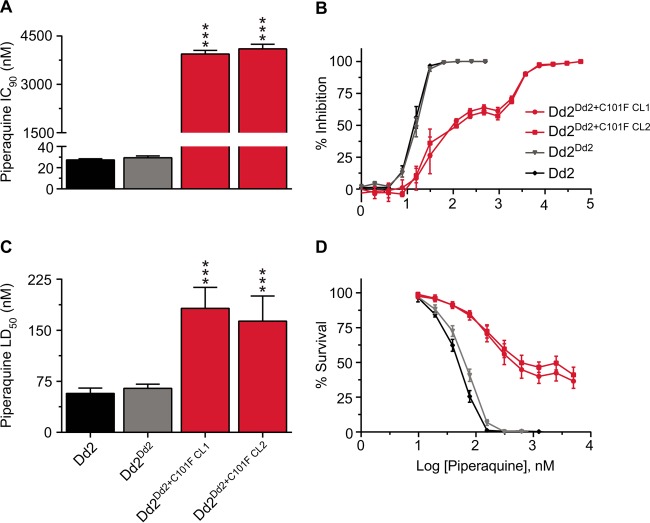
FIG 2 .
In vitro IC90 and LD50 profiles of the pfcrt-modified lines for piperaquine. (A) Piperaquine (PPQ) IC90 (nanomolar concentration) profiles of pfcrt-modified lines and their Dd2 parent. Parasites were exposed to a range of PPQ concentrations for 72 h, and parasitemias were measured by flow cytometry. Mean ± SEM IC90 values are presented for PPQ (assays performed in duplicate on 9 to 11 separate occasions [Table S1]). (B) PPQ concentration-dependent growth inhibition curves (mean ± SEM) for pfcrt-modified and parental Dd2 lines. (C) PPQ cytocidal potency against the same lines. LD50 values were determined by incubating parasites with a range of PPQ concentrations (2-fold dilution, starting concentration of 5,000 nM) for 6 h, after which the drug was removed. Growth was assessed 48 h later by determining the parasitemia using flow cytometry. LD50 values are presented as means ± SEM (assays performed in duplicate on 7 to 9 separate occasions [Table S1]). (D) Parasite survival curves (with means ± SEM) of PPQ-treated parasites tested in cytocidal assays (see Table S2 in the supplemental material for representative parasitemias). For panels A and C, the Dd2Dd2+C101F clones were statistically compared to the isogenic control Dd2Dd2 using two-tailed Mann-Whitney U tests. ***, P < 0.001.

