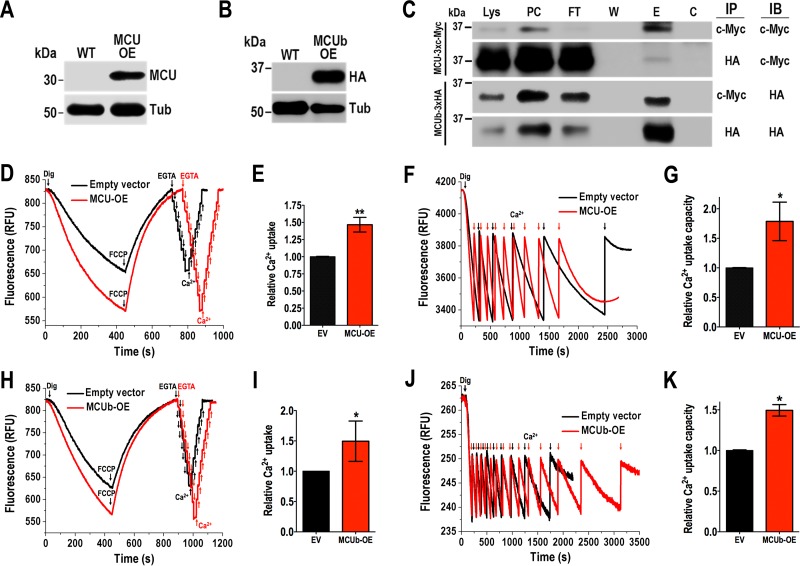
FIG 2 .
Coimmunoprecipitation of TcMCU and TcMCUb and Ca2+ uptake by TcMCU- and TcMCUb-overexpressing cells. (A) Western blot analysis of TcMCU in total protein extracts of wild-type (WT) and TcMCU-OE (MCU-OE) epimastigotes, using anti-TbMCU antibodies. Anti-α-tubulin antibodies were used as a loading control. (B) Western blot analysis of total protein extracts of wild-type (WT) and TcMCUb-3×HA-OE (MCUb OE) epimastigotes using anti-HA antibodies. Anti-α-tubulin antibodies were used as a loading control. (C) Anti-c-Myc and anti-HA immunoprecipitations (IP) using lysates from epimastigotes overexpressing TcMCUb-3×HA and TcMCU-3×c-Myc. Immunoblot assays (IB) were done with anti-c-Myc and anti-HA antibodies. Analyzed fractions were as follows: Lys, total lysate; PC, precleared lysate; FT, flowthrough; W, last wash; E, eluate; C, control agarose. (D) Ca2+ uptake by digitonin-permeabilized empty vector (pTREX-n) and TcMCU-OE (MCU-OE) cells. Other additions were as in Fig. 1I. EGTA (4 µM) and Ca2+ (2 µM pulses) were added where indicated. (E) Quantification of data in panel D. Relative Ca2+ uptake at 400 s compared with empty vector (EV). (F) Similar conditions as in panel D, except that reaction buffer contained 0.2% bovine serum albumin and further CaCl2 pulses (6 µM each time) were added to empty vector and MCU-OE cells to show the high mitochondrial capacity to take up Ca2+. (G) Quantification of data in panel F. Relative Ca2+ uptake capacity (number of Ca2+ pulses) compared with that of empty vector cells. (H) Ca2+ uptake by digitonin-permeabilized empty vector (pTREX-n) and MCUb-OE cells. Other additions were as in Fig. 1K. EGTA (4 µM) and Ca2+ (2 µM pulses) were added where indicated. (I) Quantification of data in panel H. Relative Ca2+ uptake at 400 s compared with empty vector. (J) Similar conditions as in panel H except that reaction buffer contained 0.2% bovine serum albumin and further CaCl2 additions (6 µM each time) were added to empty vector and MCUb-OE cells to show the high mitochondrial capacity to take up Ca2+. (K) Quantification of data in panel J. Relative Ca2+ uptake capacity (number of Ca2+ pulses) compared with that of empty vector cells. Values in panels E, G, I, and K are means ± SD (n = 3). *, P < 0.05; **, P < 0.01.

