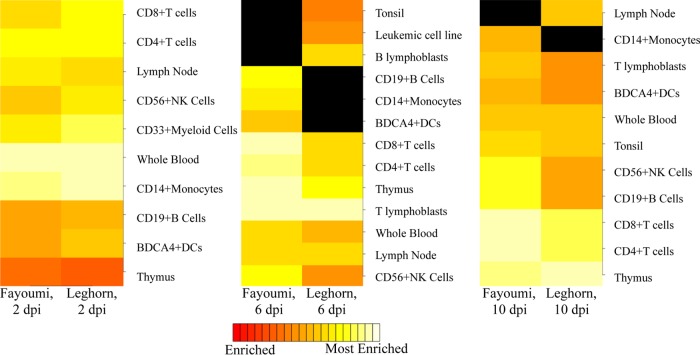
FIG 4.
Cell type enrichment analysis predicts enriched cell types from DEG between challenged and nonchallenged birds within each line at each time. The top 10 most significantly enriched cell types (listed to the right of each heat map) range from enriched (red) to most enriched (white) in either the Fayoumis or Leghorns, grouped by time. A black fill indicates a cell type that does not fall into the top 10 enriched cell types of one line but does in the other. Abbreviations: DCs, dendritic cells; Leukemic cell line, leukemia promyelotic HL-60 cells; B lymphoblasts, Burkitt's lymphoma (Daudi); T lymphoblasts, leukemia lymphoblastic (MOLT-4) cells.

